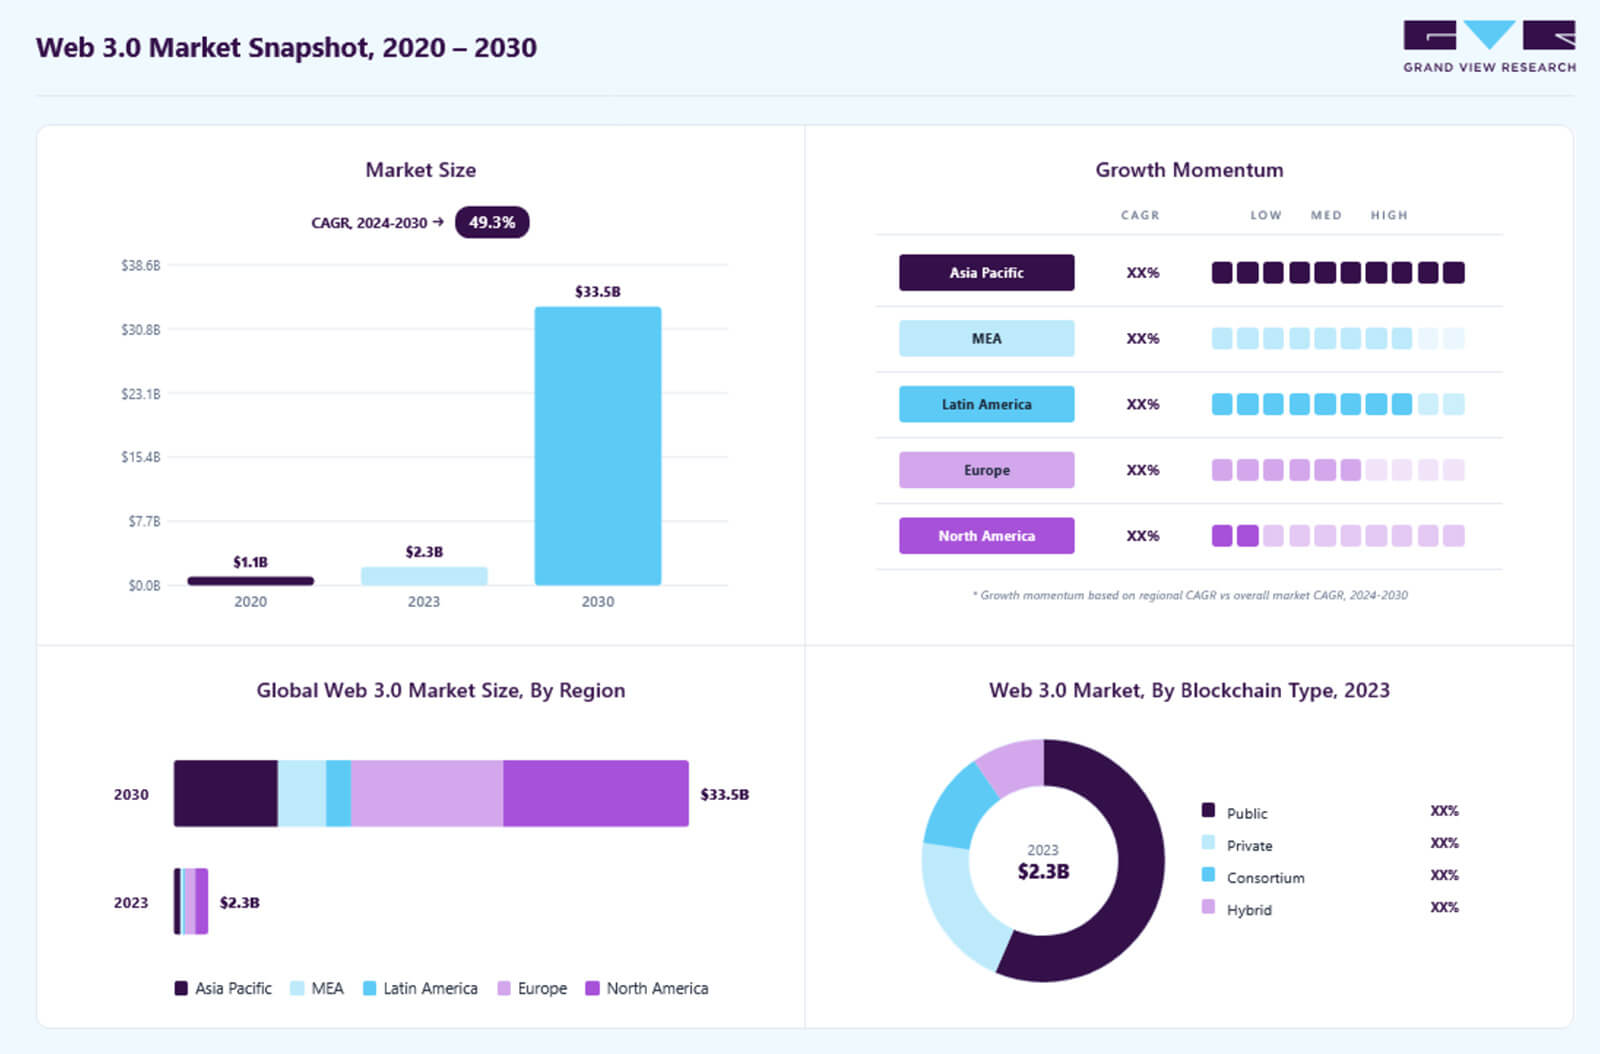
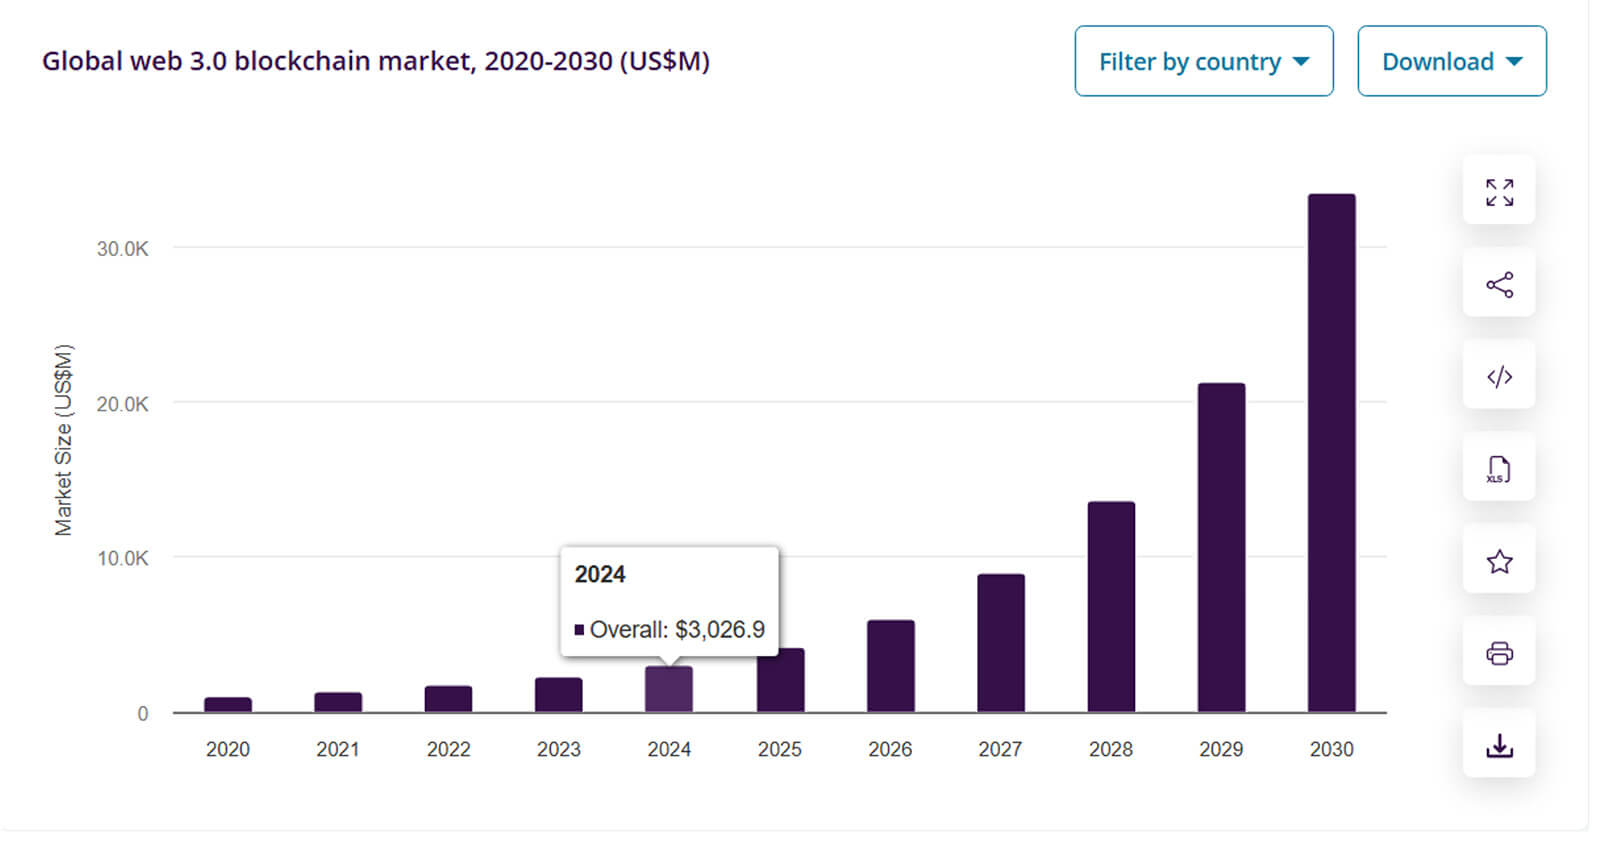
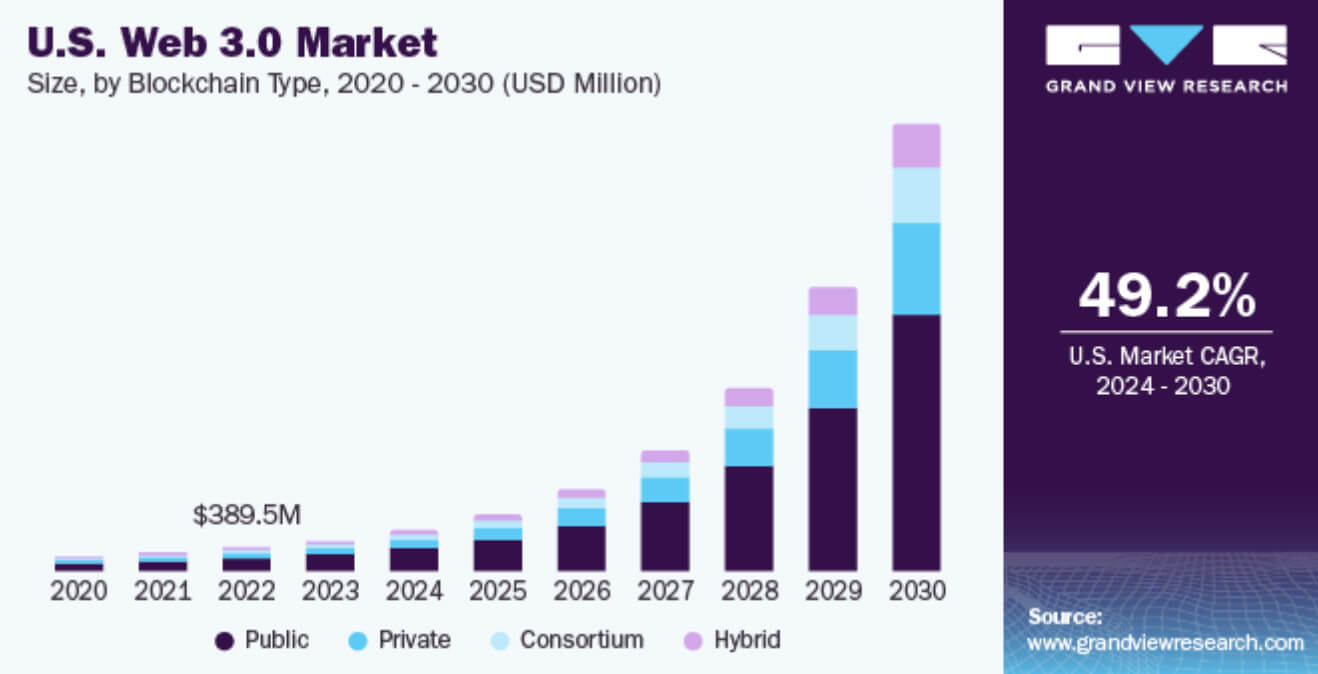
- Depending on methodology, the Web3 market is estimated at $3.47–$8.85B in 2025 and projected to reach $30–$52B by 2030–2031 at a CAGR of ~43–50%.
- Daily dApp wallet activity peaked at 24.6M dUAW in Q1 2025, then fell to 18.7M by Q3 2025 — gaming remains the most resilient sector, holding 25% market share.
- Crypto VC is back: Q1 2025 recorded $4.8B — the strongest quarter since late 2022; total H1 2025 funding exceeded $16B.
- Ethereum holds ~68% of total DeFi TVL; the Ethereum ecosystem's TVL exceeded $99B in 2025 — 68% of the entire market.
- Solidity developers earn $100K–$250K/year, median ~$150K; smart contract auditors command $150K–$250K+; the qualified engineer shortage remains the sharpest operational bottleneck.
In 2025, depending on methodology, different research firms valued the Web3 market very differently — from $3.47B (Mordor Intelligence) to $8.85B (The Business Research Company). The discrepancy comes down to scope: some count only infrastructure software, others include DeFi protocols and NFT platforms. What all forecasts share is direction: growth at a CAGR of 43–50% through 2030–2031. For CTOs, startup founders, and product managers making budget decisions, the absolute figures matter less than the growth structure — where exactly capital is flowing and where development demand is forming.
This article breaks down current Web3 statistical data for 2025–2026: market size, adoption metrics, developer activity, investment flows, the talent market, and blockchain ecosystem data — sourced from DappRadar, DefiLlama, Chainalysis, Electric Capital, and CryptoRank reports.
Key Web3 Statistics for 2026: Quick Reference Table
Below is a summary across key analytical categories as web3 adoption statistics 2026:
| Category | Statistic | Business Significance |
| Market Size | Web3 market in 2025: $3.47–$8.85B depending on methodology (Mordor Intelligence / TBRC) | Market has shifted from PoC to production infrastructure — capital flows toward utility, not speculation |
| Market Growth | Forecast to 2030–2031: $30–$52B, CAGR ~43–50% | Consistently high projected returns sustain enterprise investment in long-term infrastructure |
| User Adoption | 24.6M dUAW in Q1 2025 → 18.7M in Q3 2025 (DappRadar) | Activity has stabilized around products with real utility; speculative traffic has exited |
| Gaming | 5.8M daily wallets in Q1 2025; 25% dApp activity market share in Q3 2025 | Gaming is the most resilient user acquisition and retention channel in Web3 |
| Regional Growth | Asia-Pacific is the fastest-growing market; APAC accounts for ~350M active wallets (43% of global total) | APAC is critical for mobile-first Web3 products and stablecoin strategies |
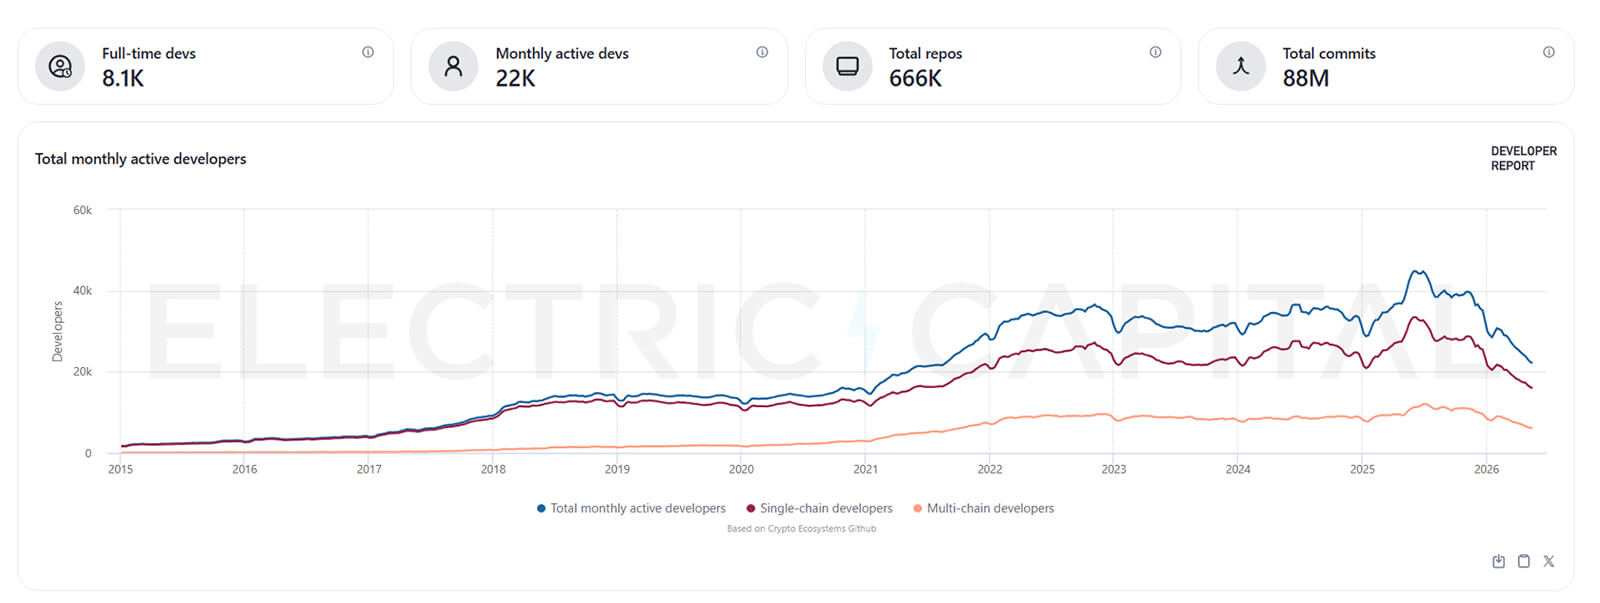
| Developers | ~25,000 full-time Web3 developers in 2024 (Electric Capital); +40% since 2022 | Growth in full-time contributors is a leading indicator of ecosystem maturity |
| Programming Languages | Solidity and Rust dominate; Solana posted a 40% YoY increase in Rust job openings | The shortage of qualified Rust/Solidity engineers is deepening |
| Investment | Q1 2025: $4.8B VC (strongest quarter since late 2022); H1 2025: >$16B | Capital is back, but going into infrastructure and tokenization — not NFT hype |
| DeFi Infrastructure | Ethereum: $99B TVL in 2025, 68% of total DeFi TVL (DefiLlama) | Ethereum remains the primary settlement layer for DeFi and enterprise tokenization |
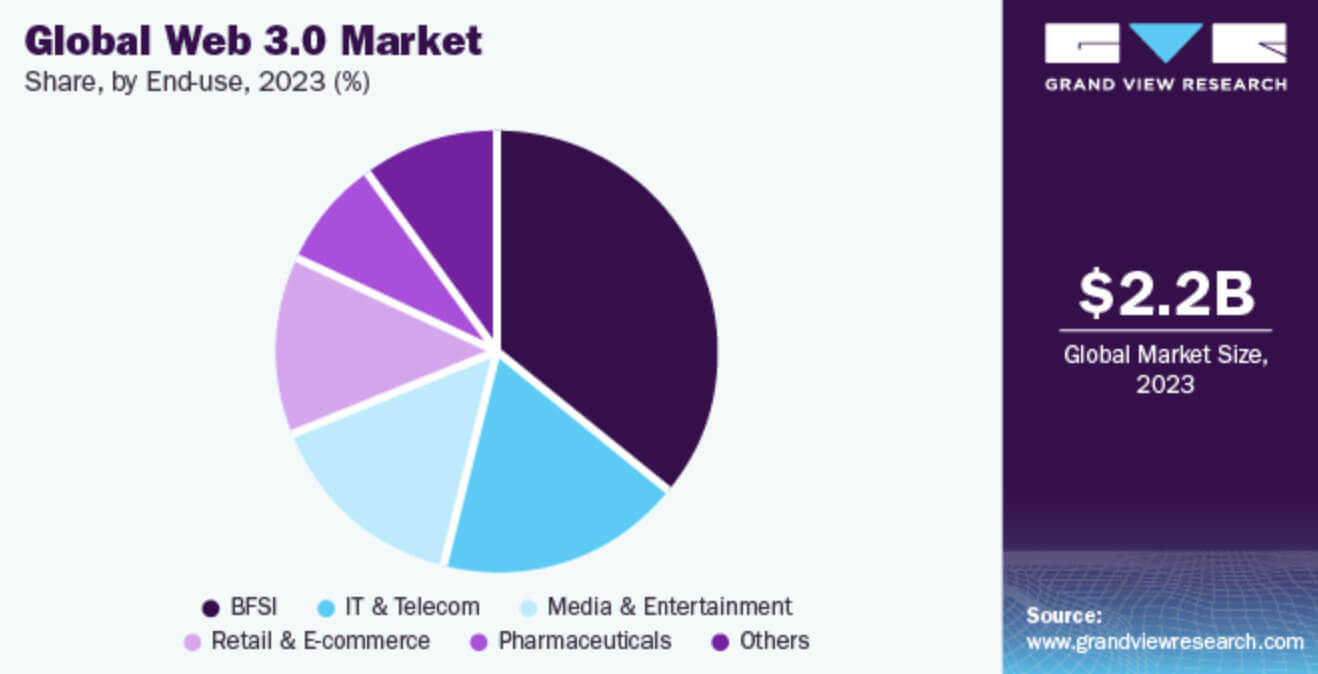
| Industry Adoption | BFSI sector: ~36% of Web3 market revenue; stablecoins processed $18.8T in settlements in 2025 | Banks, fintechs, and payment processors are the largest enterprise Web3 consumers |
| Job Market | Solidity developer: $100K–$250K/year, median ~$150K (web3.career, web3vacancy) | The talent shortage remains an operational bottleneck, not a financial one |
| Security | $3–4B lost to Web3 exploits in 2025 (Chainalysis); January 2025 alone saw $62M in one month | Security audits are a non-negotiable budget line, not an optional one |
The data makes clear that in 2026, Web3 development is defined by infrastructure growth, enterprise adoption, and developer ecosystem maturity. The sections below examine exactly where this growth is occurring and what it means for companies building in this space.
Web3 Market Size and Growth Statistics
The Web3 market continues to grow despite cryptocurrency market volatility in 2022–2024. Most research firms now treat Web3 as a long-term infrastructure category rather than a speculative trend.
Key market statistics (web3 ecosystem growth statistics 2026):
- The Web3 market in 2025 is estimated at $3.47–$9.93B depending on methodology and research scope.
- 2026 forecast: $4.97–$12.61B; by 2030–2031: $30–$52B (CAGR 43–50%).
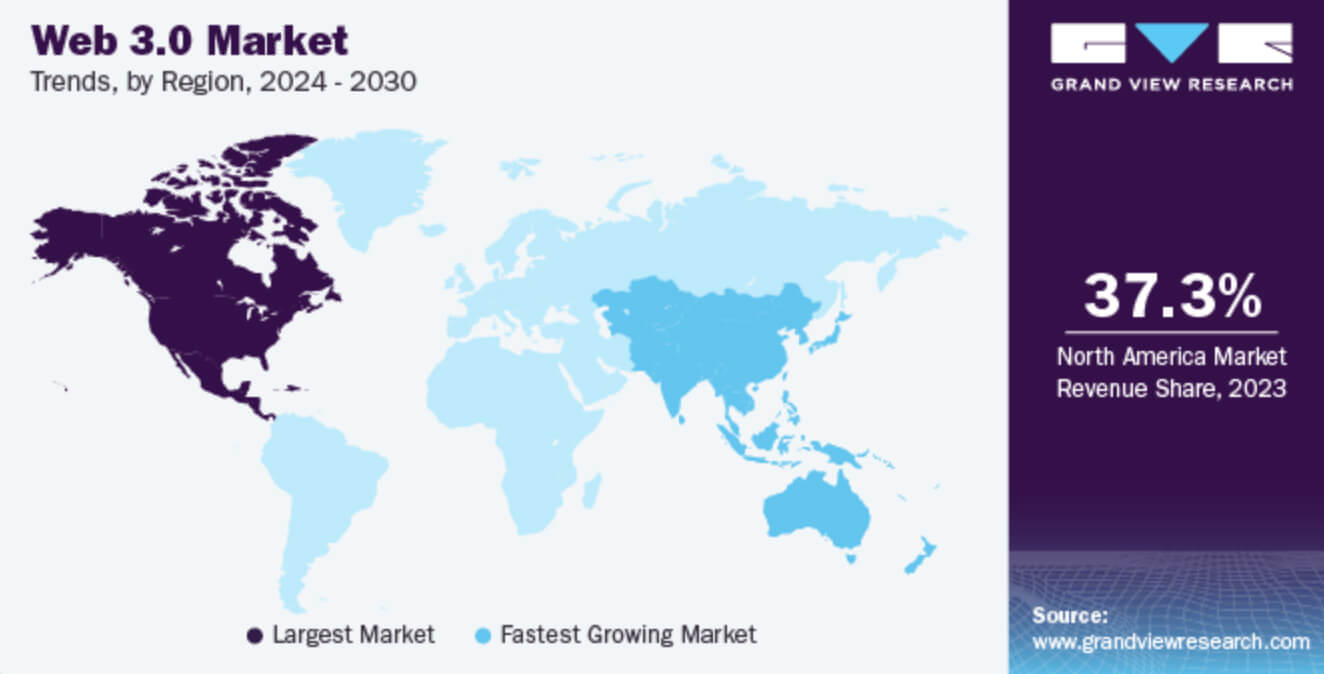
- North America accounts for 37–39% of Web3 market revenue in 2025; the largest share of venture funding and protocol development.
- Asia-Pacific is the fastest-growing region; projected regional CAGR of ~45.9% through 2031.
- Layer-1 protocols control 76.45% of the Web3 market in 2025; Layer-3 architectures are growing fastest at a CAGR of 46.4% through 2031.
- Public permissionless chains hold 83.55% of the market; consortium/hybrid chains are gaining share driven by enterprise demand.
- BFSI sector: ~36% of Web3 revenue; stablecoins processed $18.8T in settlements on Ethereum in 2025.
- Growth is increasingly driven by enterprise blockchain infrastructure, decentralized identity systems, tokenized assets, and AI-integrated dApps.
Most analysts now compare Web3's growth trajectory to the early-stage cloud computing market of the late 2000s. For businesses, these figures mean Web3 is no longer limited to token issuance or speculative trading — the market is expanding into infrastructure services, enterprise integration, identity systems, and programmable finance.
 Yuri MusienkoBusiness developer, Merehead
How broadly are users actually adopting these technologies? We examine that in the next section.
Web3 User Adoption Statistics
Web3 user adoption accelerated between 2022 and 2025, though growth rates vary significantly by region and sector. Notably, 2025 proved uneven: peak activity in Q1, followed by a correction through Q3.
Current web3 user adoption statistics 2026 (per DappRadar and CoinLaw):
- Q1 2025: 24.6M daily unique active wallets (dUAW) across Web3 dApps — the year's peak, a slight 3% decline QoQ.
- Q2 2025: 24.3M dUAW (+247% year-over-year vs. Q2 2024, but -2.5% QoQ).
- Q3 2025: 18.7M dUAW — a 22.4% QoQ drop driven by macroeconomic instability and the exit of speculative traffic.
- Blockchain gaming in Q1 2025: 5.8M daily wallets; by Q3 2025: ~4.66M (+4.4% YoY despite the broad decline).
- Gaming retained 25% of dApp activity market share in Q3 2025 — the only sector that held its position.
- Global crypto wallets: >820M active users in 2025 (~15% of internet population).
- APAC: ~350M active wallets — 43% of global volume.
- AI dApp activity grew ~26.9% in April 2025, then contracted in Q3 — the AI sector proved the most volatile.
Stablecoin adoption became the primary driver of new registrations in emerging markets in 2025. Mobile-first onboarding dominates in APAC. Wallet abstraction and account abstraction technologies significantly reduced onboarding friction throughout 2025.
| Region | Adoption Trend | Key Drivers |
| Asia-Pacific | Fastest growth (~350M active wallets) | Gaming, mobile wallets, stablecoins |
| North America | Mature ecosystem (~134M wallets) | Infrastructure, DeFi, venture funding |
| Europe | Active enterprise adoption (~140M, +12% YoY) | Regulatory clarity (MiCA), tokenization |
| Latin America | Rapid wallet growth (~92M; +116.5% crypto ownership 2023–2024) | Inflation hedging, remittances |
| Africa | Strong growth (~75M, ×2 over two years) | Stablecoins, mobile payments |
For companies building Web3 products, these figures indicate that usability and mobile onboarding are becoming more critical than token mechanics. This shift in priorities directly impacts developer ecosystems.
Web3 Developer Statistics
Developer activity remains one of the strongest indicators of long-term Web3 ecosystem health.
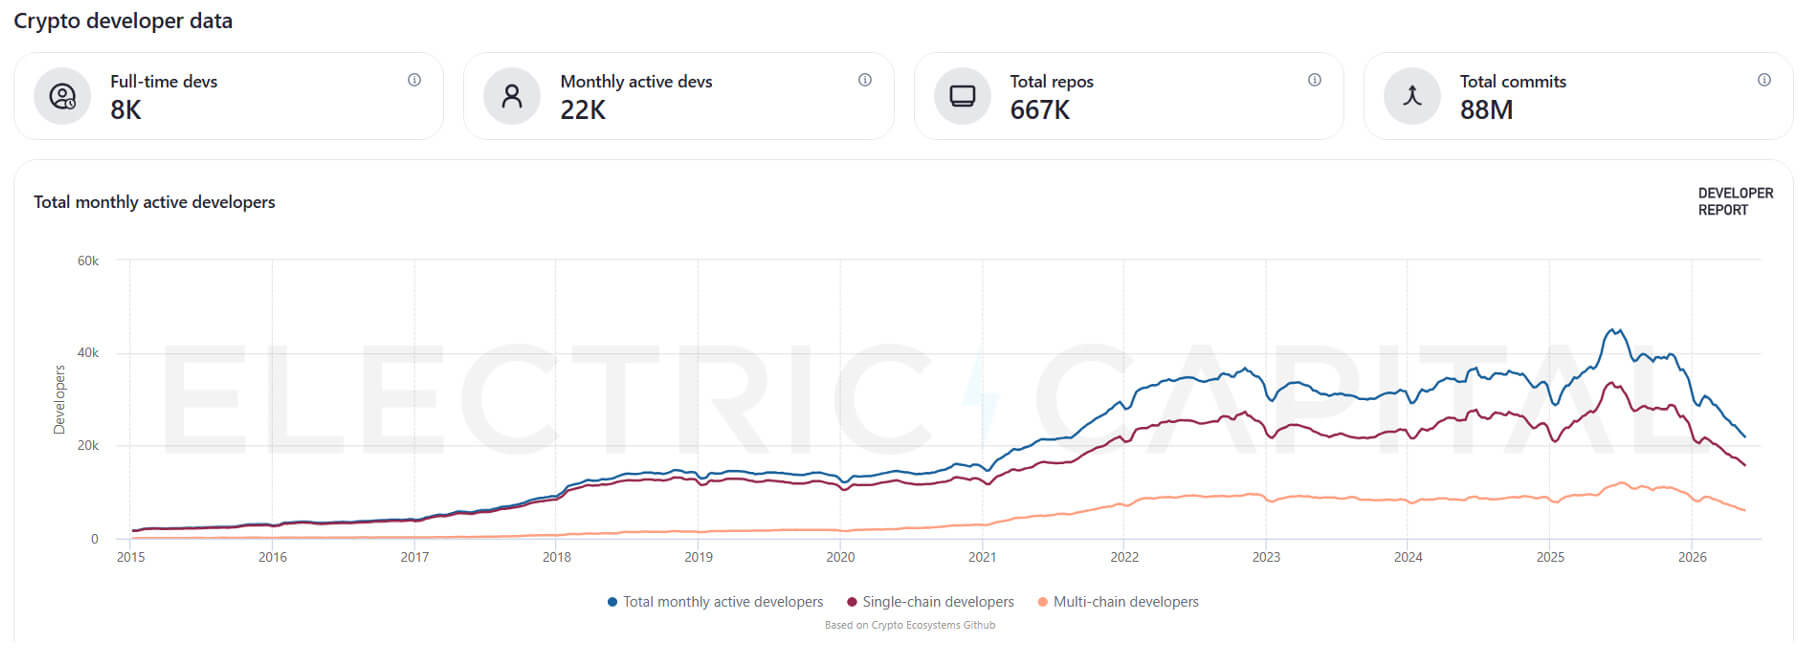
According to the Electric Capital Developer Report and ecosystem analytics:
- ~25,000 full-time Web3 developers in 2024; 40%+ growth since 2022.
- Ethereum remains the largest developer ecosystem by contributor count.
- Solidity dominates smart contract development; Rust is accelerating through Solana, Cosmos, and Near.
- Solana posted a 40% YoY increase in Rust job openings in 2025.
- More than 85,000 smart contracts were deployed on Ethereum monthly in 2025.
- Infrastructure tooling is one of the fastest-growing development sectors in 2024–2025.
- AI tool integration into smart contract workflows has significantly increased developer productivity.
Leading Web3 programming languages by primary use case:
| Language | Primary Use Case |
| Solidity | Ethereum smart contracts, DeFi protocols |
| Rust | Solana, Cosmos, Near, ZK systems |
| TypeScript | dApp frontends and SDKs |
| Go | Blockchain infrastructure, node clients |
| Python | Analytics, AI integration, ML layer |
Compared to Web2, Web3 continues to face a shortage of qualified engineers — particularly in security design and protocol architecture. This is precisely what drives aggressive capital flows into infrastructure companies. If you're planning to develop a blockchain application, budget for talent acquisition as seriously as you budget for the build itself.
Web3 Investment and Funding Statistics
After the 2021 peak, Web3 investment cycles became more selective — but in 2025, venture capital returned, operating under a fundamentally different logic. According to CryptoRank, Web3 VC inflows in 2025 approached 2022 levels.
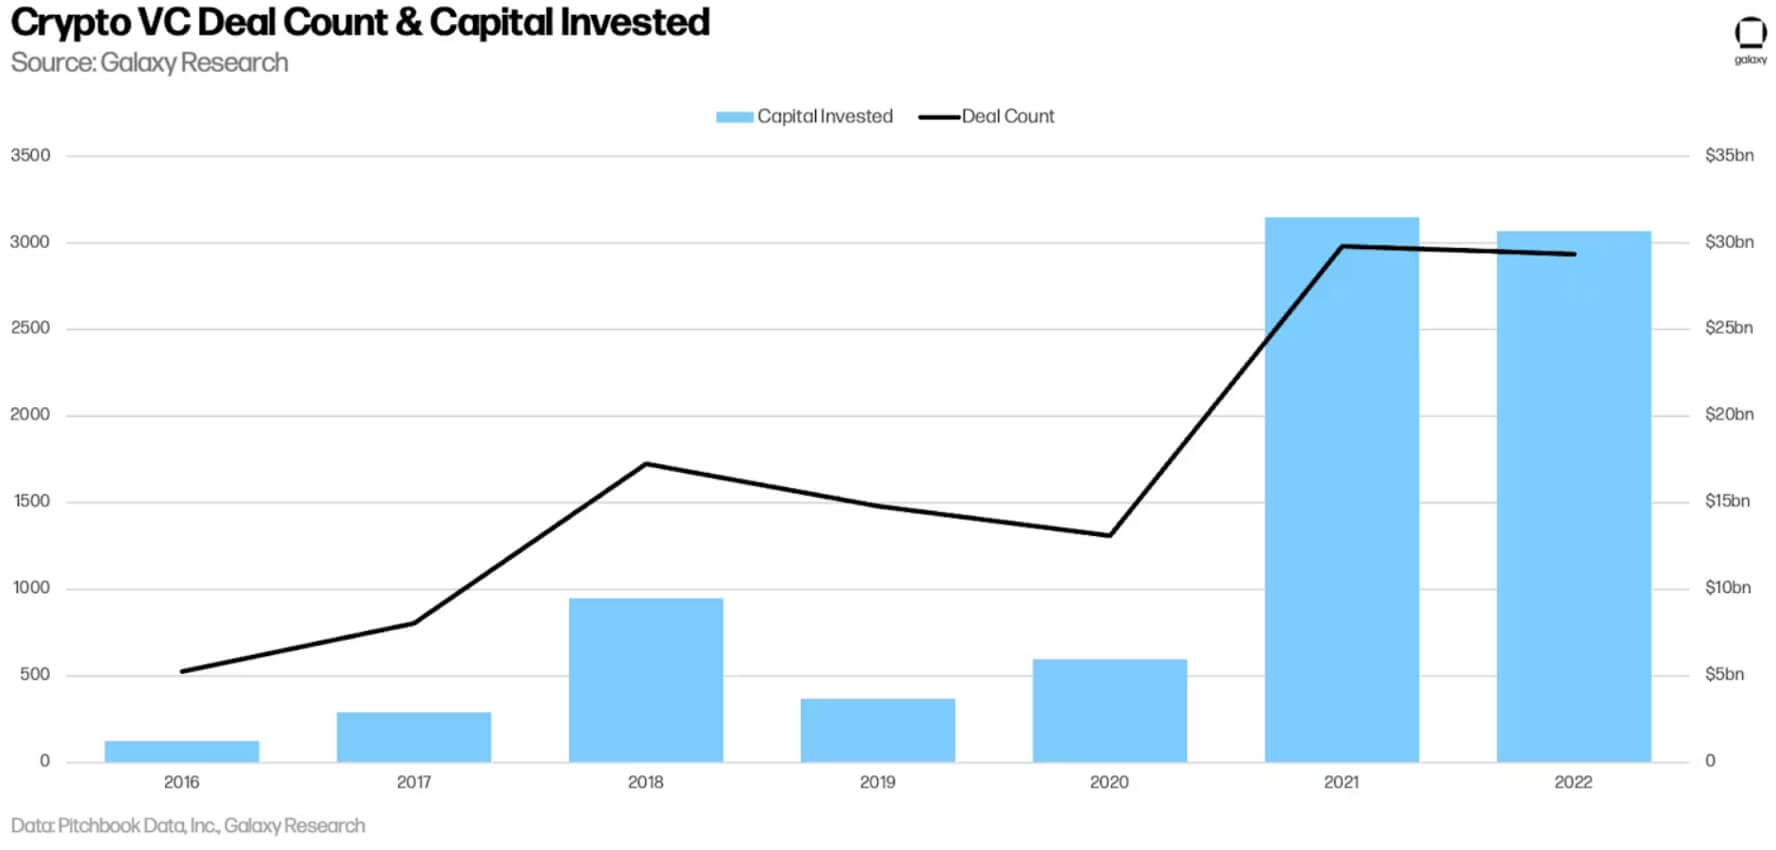
Key data points:
- Q1 2025: $4.8B — the strongest quarter since late 2022; roughly 60% of all VC capital raised throughout 2024.
- H1 2025: >$16B in total VC funding for crypto/blockchain companies.
- Q3 2025: $4.65B; ~$8B concentrated in infrastructure and DeFi platforms.
- 2025 total: 1,179 Web3 VC deals — 29.6% fewer YoY but at higher average ticket sizes; 52% of Q2 2025 capital went into late-stage rounds (Series B/C+).
- Web3 gaming: $91M in Q1 2025 — active but selective.
- AI + blockchain: the fastest-growing investment segment; AI startups attracted 46% of global VC in Q3 2025.
| Sector | Investment Trend 2025 |
| Infrastructure | Strong, sustained growth |
| DeFi / Stablecoins | Active recovery |
| Gaming | Active but selective |
| NFT | Declining relative share |
| AI + Web3 | Fastest growth |
| RWA Tokenization | New priority segment |
For founders, the data is unambiguous: investors are prioritizing durable infrastructure and real utility. Projects getting funded in 2025–2026 solve concrete problems — fee transparency, cross-chain interoperability, KYC/AML compliance, asset tokenization.
Yuri MusienkoBusiness developer, MereheadWeb3 Adoption by Industry
Web3 adoption varies significantly across industries; the financial sector and gaming continue to lead.
| Industry | Adoption Level | Primary Use Case |
| Finance / DeFi | Highest (~36% of Web3 market revenue) | Payments, lending, tokenization, stablecoins |
| Gaming | High (25% of dApp activity) | Digital ownership, in-game economies |
| Supply Chain | Moderate | Asset tracking, transparency |
| Healthcare | Growing | Identity and medical records |
| Media & Creator Economy | Growing | Royalties, creator monetization |
| Enterprise SaaS | Emerging (>$17.5B in RWA DeFi) | Identity, access management, tokenized assets |
In 2025, stablecoins became integral to cross-border payment infrastructure. Enterprise interest shifted toward tokenization and decentralized identity. The practical implication: Web3 adoption is increasingly infrastructure-driven rather than consumer-hype-driven.
Real estate tokenization is a concrete example: on-chain fractional ownership and programmable settlement eliminate the intermediary layers that inflate costs in traditional markets. Our team has documented the technical architecture and real-world cases behind blockchain-based real estate platforms in detail.
Web3 Job Market Statistics
The Web3 job market stabilized in 2025 after significant volatility in the previous crypto cycle. The key shift: salaries rose 20–30% compared to early 2024.
Current web3 job market statistics 2026:
| Role | Estimated Salary Range (USD/year) |
| Solidity Developer | $100K–$250K (median ~$150K) |
| Smart Contract Auditor | $150K–$250K+ |
| Web3 Product Manager | $110K–$190K |
| Protocol Engineer | $150K–$280K |
| Blockchain Security Engineer | $160K–$300K |
| Rust Engineer (Solana/Polkadot) | $140K–$220K+ |
Demand for Solidity developers remains consistently high across DeFi and infrastructure startups. Security auditors and smart contract engineers are the hardest-to-fill roles in Web3. AI-integrated blockchain development became a distinct specialization in 2025.
For companies building Web3 infrastructure, hiring difficulties are often a more serious obstacle than funding itself. This is particularly visible when comparing blockchain ecosystems directly.
Web3 Statistics by Blockchain
Different blockchain ecosystems now specialize in different workload types, user bases, and application categories.
According to DefiLlama, Ethereum maintained its TVL leadership in 2025 (~$99B, 68% of the market). Solana demonstrated significant growth in active addresses, but Q3 TVL fell 33% to $13.8B as memecoin activity unwound. BNB Chain sustained high retail volume. Multi-chain deployments became standard practice in enterprise applications.
| Blockchain | Key Strengths | TVL / Position (2025) | Trend |
| Ethereum | DeFi + infrastructure | ~$99B TVL, 68% of market | Stable leadership; $45B L2 TVL |
| Solana | High throughput | $13.8B TVL in Q3 2025 (-33% QoQ) | Consumer app growth; memecoin traffic exited |
| BNB Chain | Mass market | ~$6.8B TVL | Stable retail activity |
| Hyperliquid | On-chain perp trading | $2.85B TVL (+29% QoQ) | Fastest-growing in top 10, Q3 2025 |
| Arbitrum / Base | Ethereum L2 | Arbitrum ~2.86% DeFi TVL; Base ~$4.7B | L2 gaining share in enterprise deployments |
For businesses, blockchain selection increasingly depends on product requirements rather than ecosystem hype. In practice, we have shipped systems on ETH, TRON, BSC, and Solana within a single product — each chain chosen for a specific technical reason: TRON for low-cost USDT transfers, Ethereum for institutional settlement, Solana for high-frequency user interactions. The choice is never ideological; it is an engineering decision driven by fee structures, finality times, and the client's existing liquidity relationships.
Web3 Challenges: Key Data
Despite strong growth metrics, Web3 ecosystems continue to face usability, security, and regulatory challenges.
- $3–4B lost to Web3 exploits in 2025 (Chainalysis); January 2025 alone saw $62M in losses — a 463% MoM surge in incident count.
- UI/UX issues remain one of the largest barriers to mainstream user adoption.
- Regulatory uncertainty continues to slow institutional adoption in several regions.
- Most Web3 startups fail due to unsustainable tokenomics, not technical limitations.
- Cross-chain interoperability remains technically complex for enterprise deployments.
- Gaming projects saw significant consolidation in 2025, with hundreds going inactive.
- Only 5–10% of users become repeat dApp users within 30 days of initial use.
The dynamic fee problem is a case study in what makes Web3 security harder than traditional software security. In a crypto exchange we built, the gap between the previewed network fee and the actual execution fee could invalidate a transaction's economics within seconds.
We resolved this through a threshold-based validation system: after 2FA confirmation, the backend re-fetches the current fee; if the delta exceeds the configured threshold, the transaction auto-cancels. That single architectural decision prevented what would otherwise be a continuous source of financial loss for users and reputational risk for the platform. Building exchange security at this level requires treating fee volatility as a threat vector, not just a UX inconvenience.
Yuri MusienkoBusiness developer, MereheadThese statistics suggest that Web3 growth will depend less on speculation and more on infrastructure maturity, compliance tooling, and user experience improvements.
AI and Web3 Convergence: The Emerging Architecture Layer
One of the fastest-growing segments in 2025–2026 data is the intersection of AI and blockchain. This is not incidental: the two technologies address complementary weaknesses in each other.
Pure ML systems cannot process unstructured signals — regulatory news, social sentiment, macroeconomic context — in real time. Pure LLM systems have no persistent memory between sessions and no mechanism for systematic accuracy tracking. Combining LLM agents for context, ML models for learning on numerical data, vector memory for historical pattern retrieval, and a feedback loop for self-correction creates a system where each component compensates for the other's weaknesses.
In one of our projects, we built exactly this architecture for a crypto trading signal platform: six specialized LLM agents covering technical analysis, sentiment, on-chain metrics, news classification, macroeconomic context, and a Synthesizer that weighted each agent's output dynamically based on its measured accuracy per market regime. The system runs on PostgreSQL 16 with TimescaleDB for time-series workloads and pgvector for semantic similarity search across historical market situations.
The practical result: the Synthesizer knows, for example, that the Sentiment Agent achieves 67% accuracy in trending markets but only 41% in sideways conditions — and automatically reduces its weight when the regime classifier identifies sideways conditions. This is the difference between a system that "uses AI" and a system that actually learns. If you're exploring AI trading bot development, this kind of architecture — where component-level accuracy is measured and weighted dynamically — is where production-grade systems differ from demos.
Conclusion: What Web3 Statistics Mean for Your Business
The Web3 market in 2026 looks fundamentally different from the speculative cycle of 2021. The strongest growth is now driven by infrastructure, stablecoins, tokenization, AI-integrated decentralized applications, and enterprise blockchain adoption.
The data reveals several durable patterns: Web3 user penetration continues growing globally; developer ecosystems remain active despite market volatility; infrastructure investment stays high; enterprise use cases become increasingly practical and operational; and the qualified talent shortage in security and protocol engineering persists.
For CTOs and company founders, the key fact is that Web3 increasingly functions as a long-term infrastructure platform rather than an isolated crypto niche. Companies entering this market now focus on scalability, compliance, interoperability, and user acquisition — not on speculative token models.
If you're considering building a Web3 product, working with experienced blockchain architects and infrastructure specialists can significantly reduce technical and operational risks as the ecosystem continues to mature.
Yuri MusienkoBusiness developer, MereheadFAQ
Depending on methodology and research scope: from $3.47B (Mordor Intelligence, narrow definition) to $8.85–$9.93B (TBRC/SkyQuest, broad definition) in 2025. The 2026 forecast ranges from $5B to $12.61B. By 2030–2031, the market is estimated at $30–$52B at a CAGR of 43–50%.
Over 820 million active crypto wallets globally in 2025 (~15% of the internet population). At the active dApp user level: the Q1 2025 peak was 24.6M dUAW; by Q3 2025 this had fallen to 18.7M as speculative traffic exited. Actual dApp retention is lower: only 5–10% of users become repeat users within 30 days.
According to the Electric Capital Developer Report, approximately 25,000 full-time Web3 developers in 2024 — 40%+ growth since 2022. The broader pool of monthly active contributors is considerably larger, but full-time commitment is concentrated among core protocol teams. The shortage is sharpest for security engineers and Rust developers.
Finance and DeFi account for ~36% of enterprise Web3 use cases; stablecoins processed $18.8T in settlements on Ethereum in 2025. Gaming is the largest user entry point (25% of dApp activity). Supply chain, healthcare, and the creator economy are growing but at earlier stages. RWA tokenization ($17.5B+ in DeFi) is the emerging priority segment.
Solidity Developer: $100K–$250K/year, median ~$150K (web3.career, web3vacancy). Smart Contract Auditor: $150K–$250K+. Protocol Engineer: $150K–$280K. Blockchain Security Engineer: $160K–$300K. Salaries have risen 20–30% compared to early 2024. Token compensation packages add further upside.
Smart contract and protocol exploits cost $3–4B in 2025; January 2025 alone saw $62M in one month. Regulatory uncertainty slows institutional adoption. Cross-chain interoperability remains complex for enterprise. Most projects fail due to unsustainable tokenomics rather than technical limitations. Security audits are a non-negotiable investment at production scale.