- 2.17+ billion users have mobile banking accounts worldwide in 2025 — a 35% increase since 2020
- Mobile banking accounts for 59–72% of all transactions globally in 2026
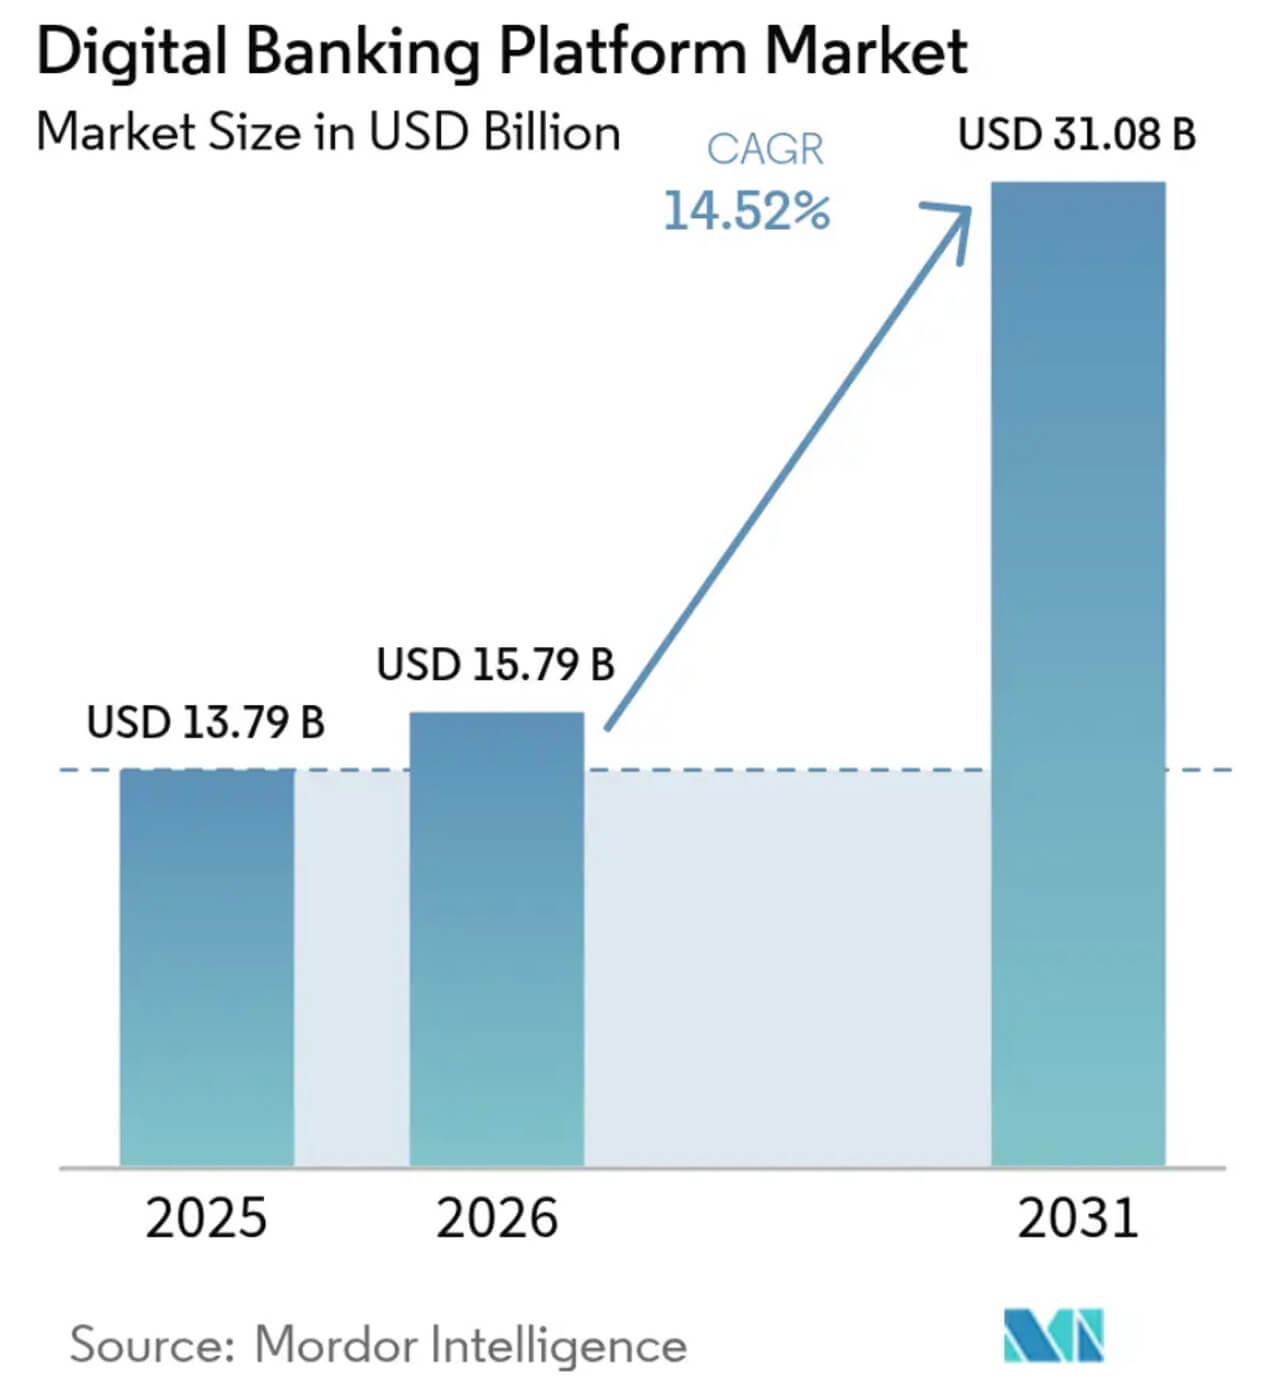
- The Digital Banking Platform Market is projected to reach $31.08 billion by 2031 (CAGR: 14.52%)
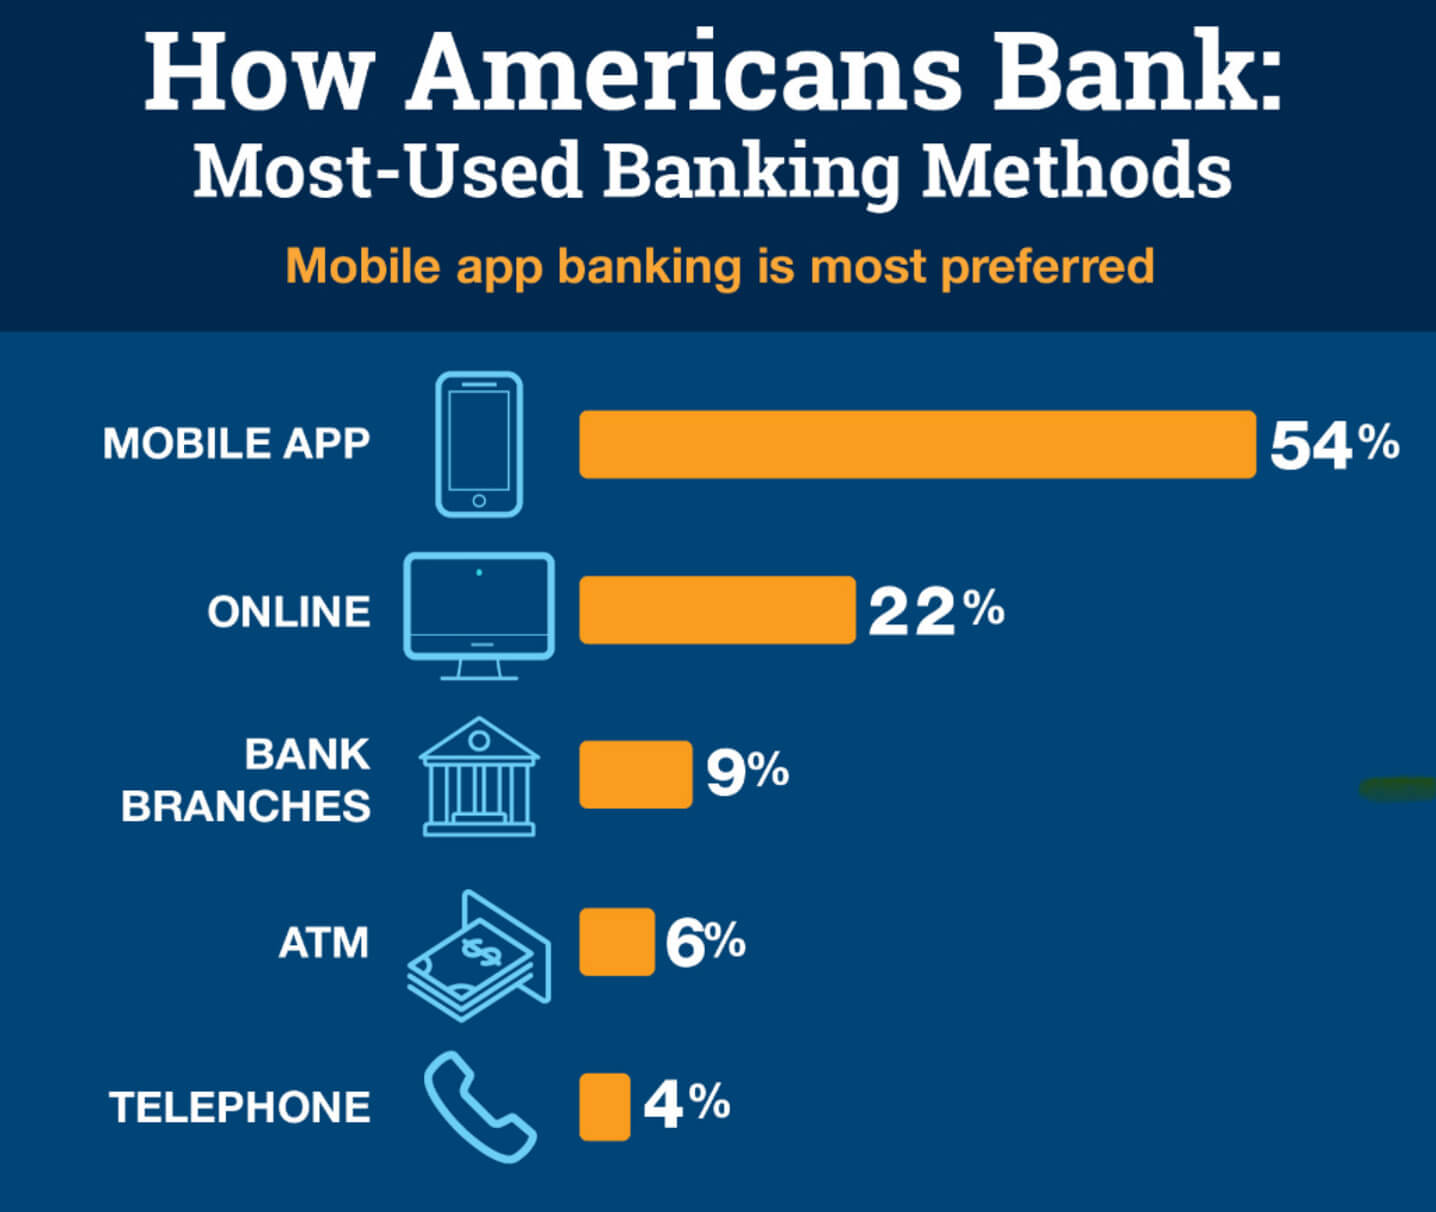
- 54% of US users name a mobile app as their primary banking method, ahead of online banking (22%) and branches (9%)
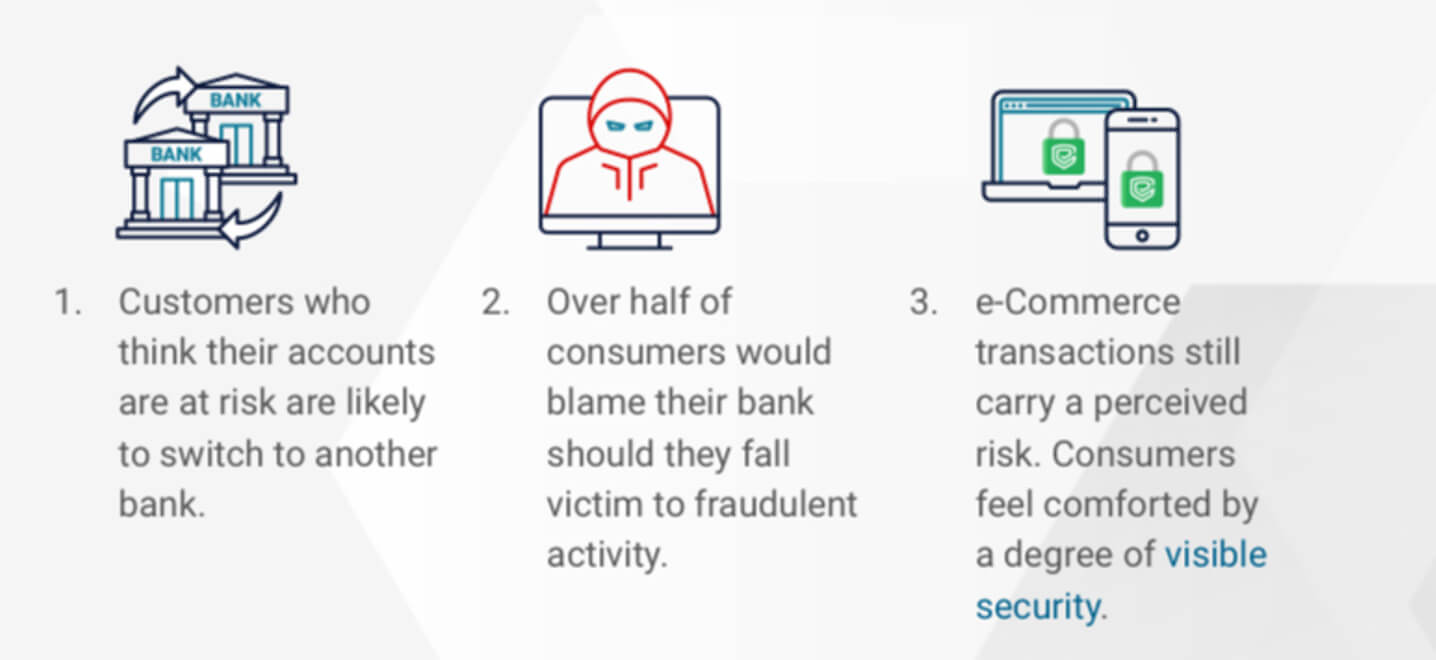
- 67% of customers say they would consider switching banks after a major data breach
- 66% of banks have deployed AI for fraud detection in 2026; 64% — biometric authentication
- Building a classic banking app (iOS + Android) costs $60,000–$100,000; white-label deployment — $5,000–15,000
The total number of mobile banking app users worldwide reached 2.17+ billion in 2025. By 2026, mobile banking has become the dominant channel: it accounts for 59% to 72% of all transactions. As a result, bank owners and fintech projects have started treating mobile apps as the core instrument for user retention and revenue generation.
Below is up-to-date mobile banking statistics for 2026, covering market size, demographic segmentation, customer behavior patterns, geographic trends, and key security and anti-fraud metrics.
This data will help business owners prioritize feature development in their banking app to increase user LTV and minimize scaling risks.
Key Mobile Banking Statistics: Quick Overview
Mobile banking statistics on user count and behavior:
- ~65% of smartphone owners use mobile banking at least once a month.
- ~48% of bank clients log into banking apps daily; 48% use smartphones for transfers; 56% check balances via mobile devices.
- According to an Entersekt survey of 5,000 banking customers in the UK, Norway, Hungary, and Germany, 72% of respondents used their banking app several times a week.
- 50% of surveyed users confirmed they would switch their bank account if they weren't confident in its security.
General mobile banking industry statistics:
- CAGR for the digital banking platform sector from 2026 to 2031: 14.52%. Expected market volume in 2031: $31.08 billion.
- Mobile banking transaction volume in 2025 reached $1,027.93 billion, with a projected CAGR through 2033 of 8.18% — per Market Reports World. This figure reflects the total volume of transactions, payments, and fee revenue processed through mobile channels.
- In 2025, North America led the digital banking platform market with a 37.35% share.
Statistics explaining growth and sector potential:
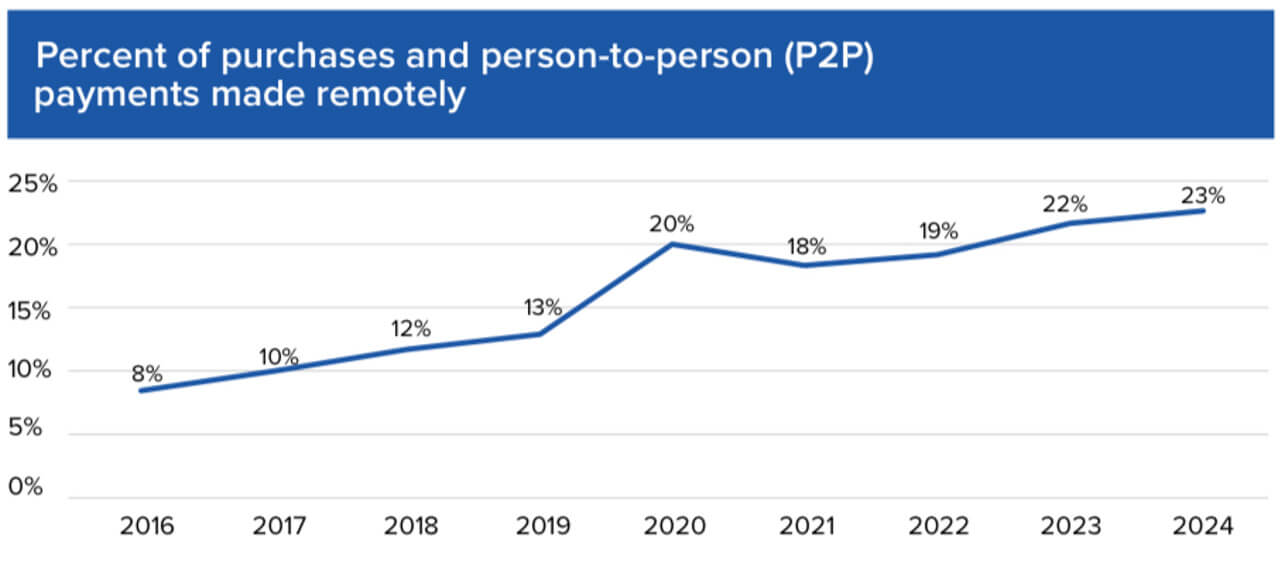
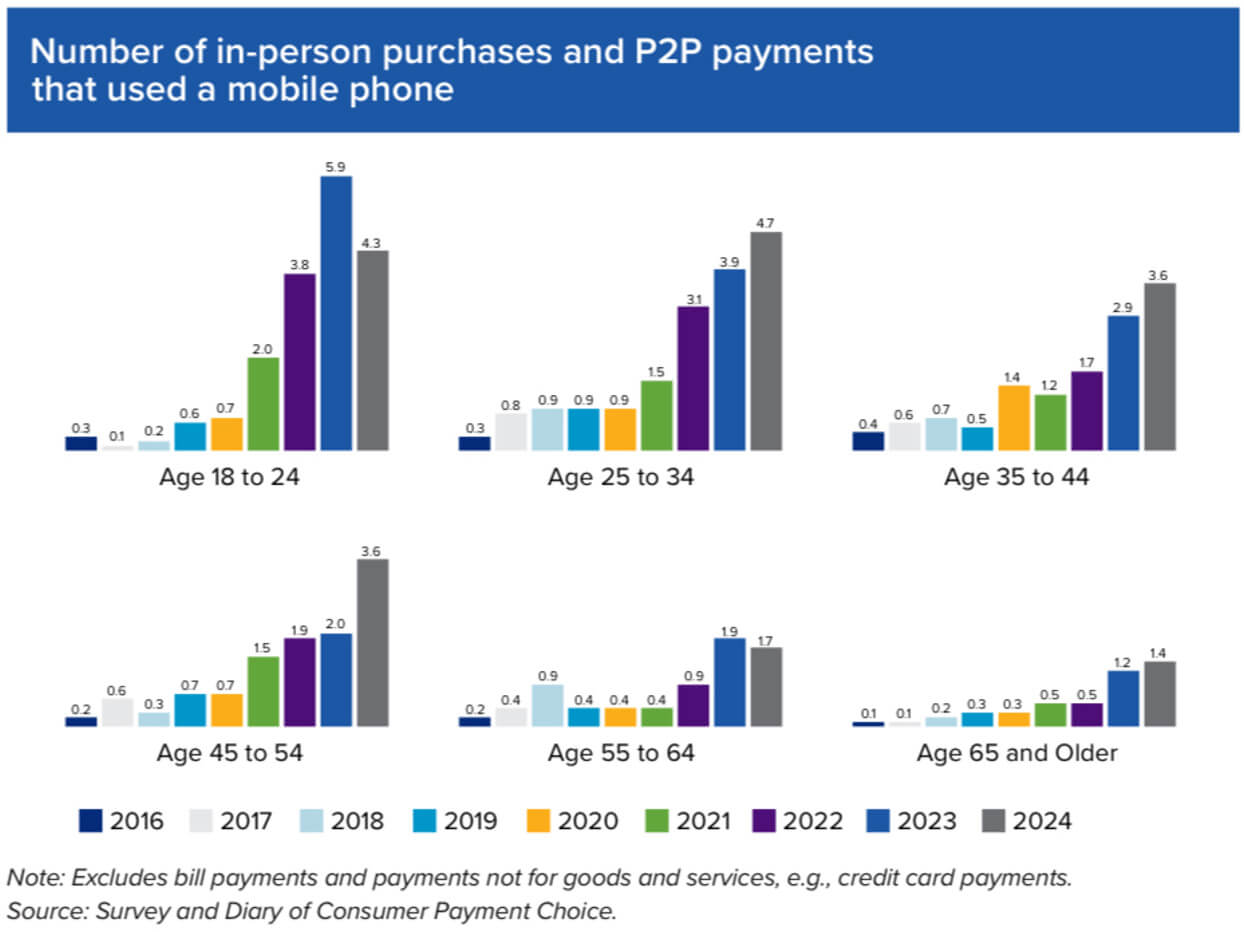
From 2016 to 2024, the share of peer-to-peer transfers and online payments grew from 8% to 23%, according to the Federal Reserve's 2025 Findings from the Diary of Consumer Payment Choice. This is one of the key drivers of more frequent banking app usage.
Global Mobile Banking Users & Market Size
In 2025, banking accounts are held by 2.17+ billion users worldwide — up 35% since 2020. The Digital Banking Platform Market size in 2025 was estimated at $13.79 billion.
Market projections:
- Mordor Intelligence forecasts the Digital Banking Platform Market will reach $15.79 billion in 2026 and $31.08 billion in 2031 (CAGR: 14.52%).
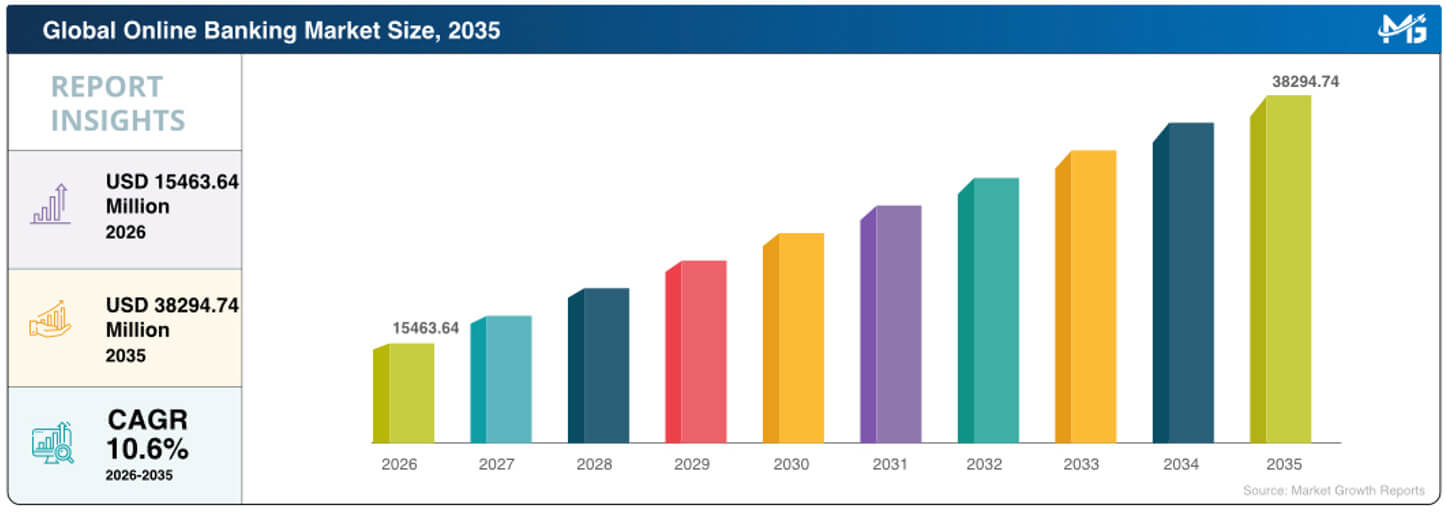
- Market Growth Reports offers a more conservative forecast: Online Banking Market growing from $15.563 billion in 2026 to $38.294 billion in 2035 (CAGR: 10.6%).
Market size dynamics from 2022 to 2026:
| Year | Digital Banking Platform Market Size |
| 2022 | ~$5.39 billion |
| 2023 | ~$5.61 billion |
| 2024 | ~$10.14 billion |
| 2025 | ~$13.79 billion |
| 2026 (forecast) | ~$15.563 billion |
Mobile Banking Statistics in the United States
According to American Bankers Association data, 54% of US users name a mobile app as their primary banking method, followed by online banking (22%). Physical branches were the preferred option for only 9% of clients in 2025.
Why? The most successful US banks have adopted the "digital hub" model: a mobile app gives clients autonomy in account management (self-configuring limits, card blocking, transfers), 24/7 access to loans, investments, currency exchange, and the ability to execute all financial operations in a single interface — far more convenient than visiting a branch.
In practice, we observe the same pattern in every fintech project we work on: the moment a product gains a complete mobile-first feature set — from KYC to P2P transfers — user retention improves significantly. The numbers in this report confirm it's not a coincidence.
 Yuri MusienkoBusiness developer, Merehead
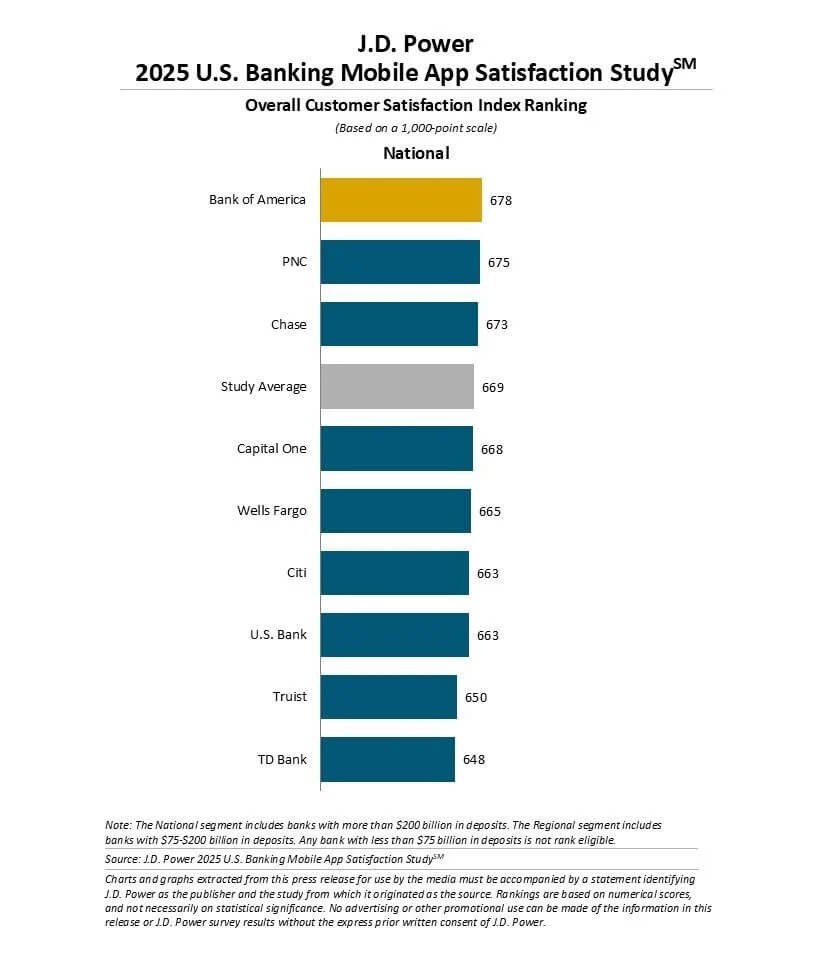
Top-rated US banking apps according to J.D. Power's U.S. Banking Mobile App Satisfaction Study:
| Bank | Customer Satisfaction Score |
| Bank of America | 678 / 1000 |
| PNC | 675 / 1000 |
| Chase | 673 / 1000 |
| Study Average | 669 / 1000 |
| Capital One | 668 / 1000 |
Key commercial metrics from Mobile Banking Market Size & Share Trends, 2033 (Market Reports World, April 2026):
- On average, a mobile banking user logged into the app 11 times per week in 2024.
- Most common in-app operations: P2P transfers, utility bill payment, mobile top-ups, credit score checks, and investment tracking.
- Personal banking was the primary use case, accounting for 74% of total mobile banking traffic in 2024.
Mobile Banking vs Online Banking in the US
According to American Bankers Association data, the gap between mobile and online banking widened significantly in 2025:
| Age group | Mobile Banking | Online Banking |
| 18–27 | 63% | 11% |
| 28–43 | 67% | 13% |
| 44–59 | 56% | 22% |
| 60–78 | 38% | 36% |
In 2026, desktop internet banking through a PC is becoming secondary. For banks, prioritizing Mobile-First development is now a baseline strategy — not an option. The only age group where online banking remains competitive is 60–78, and even there mobile is winning 38% to 36%.
Yuri MusienkoBusiness developer, MereheadMobile Banking Usage Statistics by Demographics
Overall, mobile payment volumes have grown across all age groups, but activity directly correlates with age. Gen Z and Millennials are the "digital first" cohorts and the primary transaction drivers.
Among all participants in the International Journal of Central Banking study, youth aged 25–34 drive the most transactions: they represent 11% of respondents but account for over 21% of all operations. Older users (55+) are less active: they make fewer purchases and transfers, primarily accessing apps to check balances.
Detailed demographic banking app statistics:
| Generation | Age | Active Users Share (Mobile Banking Penetration) | Core Demand |
| Generation Z | 18–27 | 63% | P2P payments, crypto integration, "financial hub" |
| Millennials | 28–43 | 67% | Autopayments, investment tools, budgeting |
| Gen X | 44–59 | 56% | Credit monitoring, account management, security |
| Baby Boomers | 60–78 | 38% | Balance checking, transfers, simple interface |
Important: Users aged 18–24 use smartphones for payments and transfers more often than any other group (~45% of all payments) — per the Federal Reserve's 2025 Findings from the Diary of Consumer Payment Choice. However, it's the 28–43 cohort that most actively uses app functionality: autopayments, investments, and budget planning tools.
Income and education level correlations from the same IJCB study:
- Clients earning less than $25,000 make up a significant portion of customers (23% of the sample) but account for only 15% of transactions. The wealthiest segment — 33% of the sample — drives 45%+ of transactions.
- The lower the education level, the lower the likelihood of using a banking app: people without a complete secondary education are 10.96 percentage points less likely to use banking apps than others; those with only a secondary education — 7.87 points less.
Gen Z & Mobile Banking
What marketers and banking app developers need to know: according to the International Journal of Central Banking (IJCB), the probability that a Gen Z client will use banking apps is 32% higher than for the 65+ generation — making them a higher-priority target audience.
Overall, consumers under 35 make mobile payments (including banking app transactions) most frequently: Gen Z averages 4 times per month, compared to 2 times per month for people aged 55+.
Additional Gen Z banking statistics:
- This group has the highest risk of switching banking apps.
- Banking app satisfaction rates hover between 93%–95%, but for Gen Z they trend toward the lower end.
From our experience integrating perpetual DEX futures directly into a non-custodial mobile wallet, the key to retaining Gen Z users isn't feature count — it's speed of access. A three-tap path to an orderbook is functionally equivalent to no orderbook at all.
Yuri MusienkoBusiness developer, MereheadMillennials & Mobile Banking
Millennials' banking app adoption (67%) slightly outpaces Gen Z (63%), and they exhibit similar behavioral patterns. Specific statistics:
- 75% of surveyed millennials manage their capital through a mobile app (sample: 1,000 Americans).
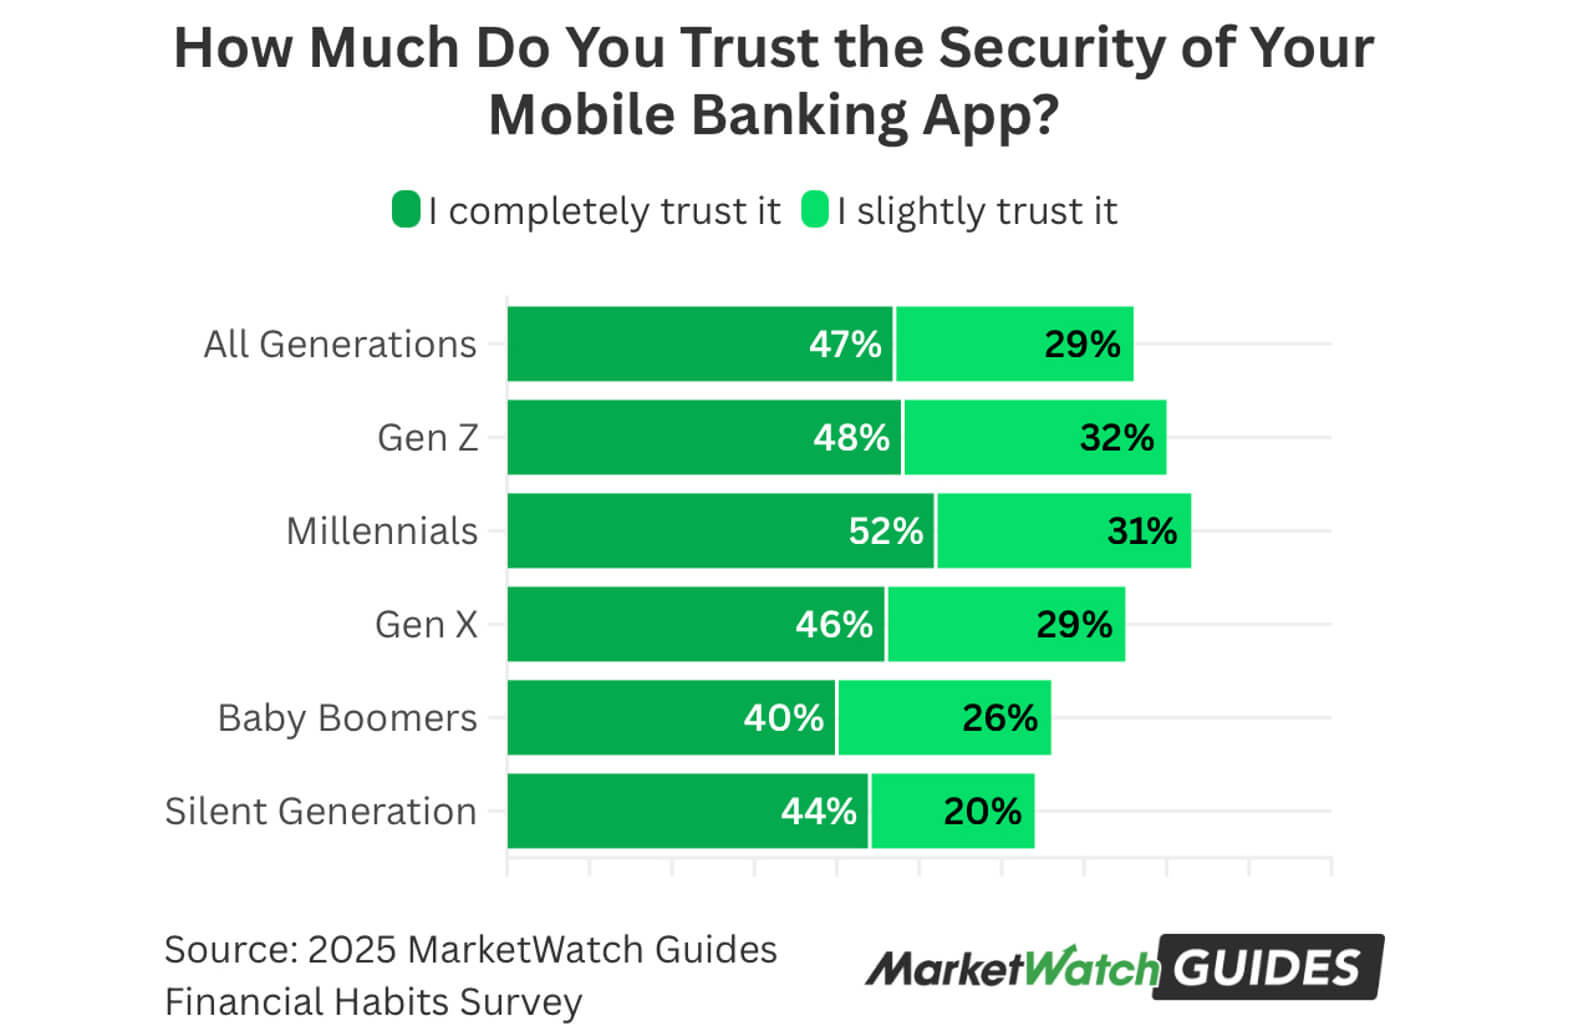
- Millennials trust their banking app more than any other group: 83%.
- ~70% of millennials allow banking apps to share information with other financial providers.
According to Deloitte, millennials — like Gen Z — are prone to switching banks when satisfaction drops.
Mobile Banking App Statistics
The top 5 banking apps in 2026 are: Chase Bank, Bank of America, PNC Bank, Revolut, and Nubank:
| Bank | Rating (App Store) | Rating (Google Play) | Top Features | Downloads |
| Chase Mobile | 4.9 | 4.9 | Biometrics, Zelle, Credit Journey, budget management, My Chase Plan | 50M+ (Google Play) |
| Bank of America | 4.8 | 4.9 | Biometrics, Erica virtual assistant, Bill Pay, investment monitoring | 50M+ (Google Play) |
| PNC Bank | 4.9 | 4.9 | Zelle, Virtual Wallet (expense analytics), mobile checks, card management | 10M+ (Google Play) |
| Nubank | 4.7 | 4.2 | Biometrics, P2P (PIX), NuTap (POS functionality), investments, crypto trading | 100M+ (Google Play) |
| Revolut | 4.8 | 4.6 | Instant transfers, multi-currency accounts, savings, crypto trading | 50M+ (Google Play) |
Key commercial metrics — Retention, DAU/MAU, and session time — are proprietary data partially available via paid subscriptions on data.ai. For top banking apps (Chase, Bank of America, Revolut, etc.), standard industry benchmarks are:
- DAU/MAU (Stickiness): The standard for banking apps in North America and Europe is 20–24%. In high-mobile-banking regions (APAC), this figure reaches 36%.
- Retention (D30): Industry standard: 11–12%. Above 15% is considered "top-tier."
- Session time: The 2026 standard for financial apps: 5–6 minutes.
Mobile Banking Adoption by Region
In 2025, North America led the digital banking platform market by revenue — 37.35%. The Asia-Pacific region is posting the highest CAGR — 16.34% (projected through 2031). By adoption rate in 2026, Europe has taken the lead.
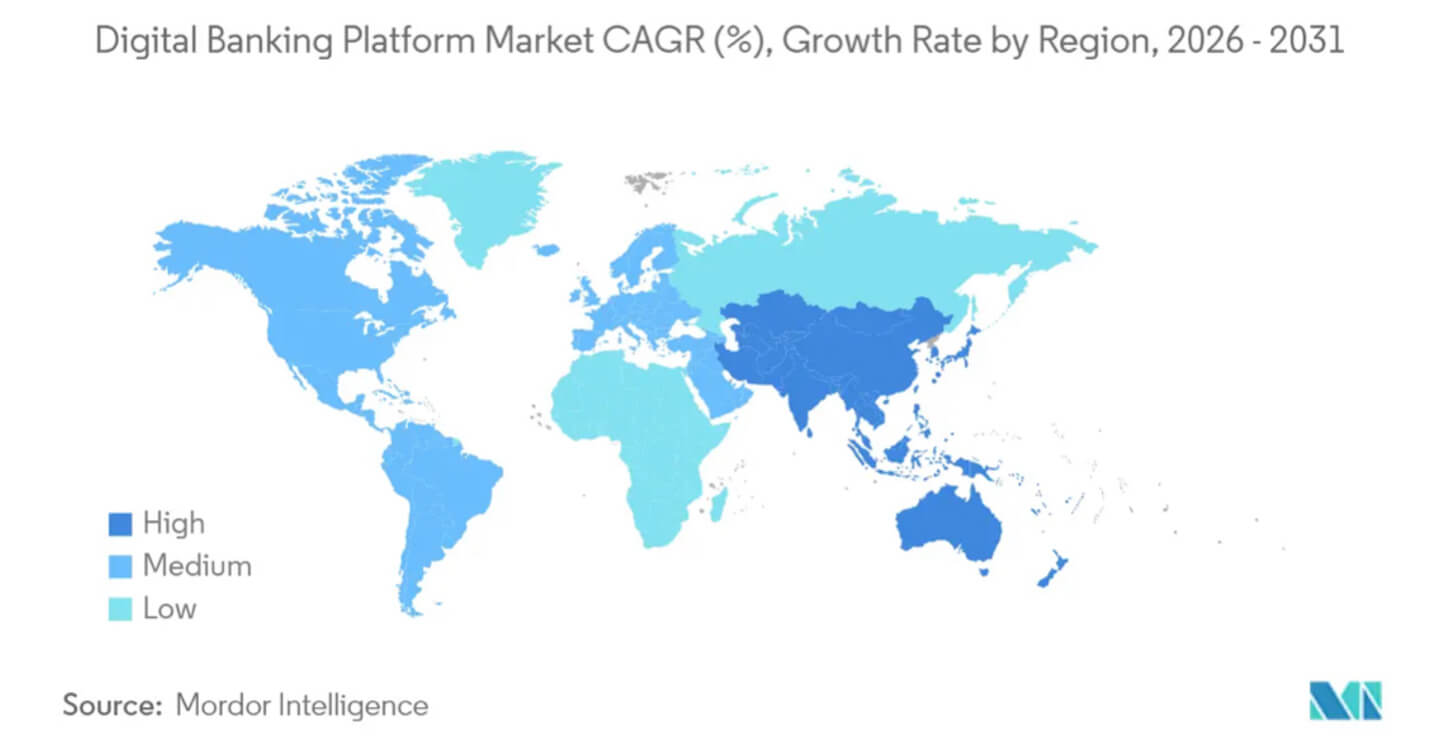
| Region | Adoption Rate | Users (2025) | Key Driver |
| North America | ~61% (Canada: 78%) | 215 million in the US | AI assistants, contactless payments, cloud infrastructure, ML fraud protection |
| Europe | ~76% | N/A (official data) | Open Banking API, real-time payments, ESG tools |
| Asia-Pacific | Up to ~60% in select markets | ~805 million | Super-apps, government digital payment programs, digital wallets, fintech partnerships |
| Latin America | N/A | N/A | Financial inclusion, neobank growth, mobile payment adoption |
| Middle East & Africa | ~35% (~51% in Gulf markets) | ~387 million | Government digitization strategies, mobile-first models, biometrics |
Notable regional adoption highlights:
- In Northern Europe, mobile banking penetration exceeded 87% in 2026 — a record high.
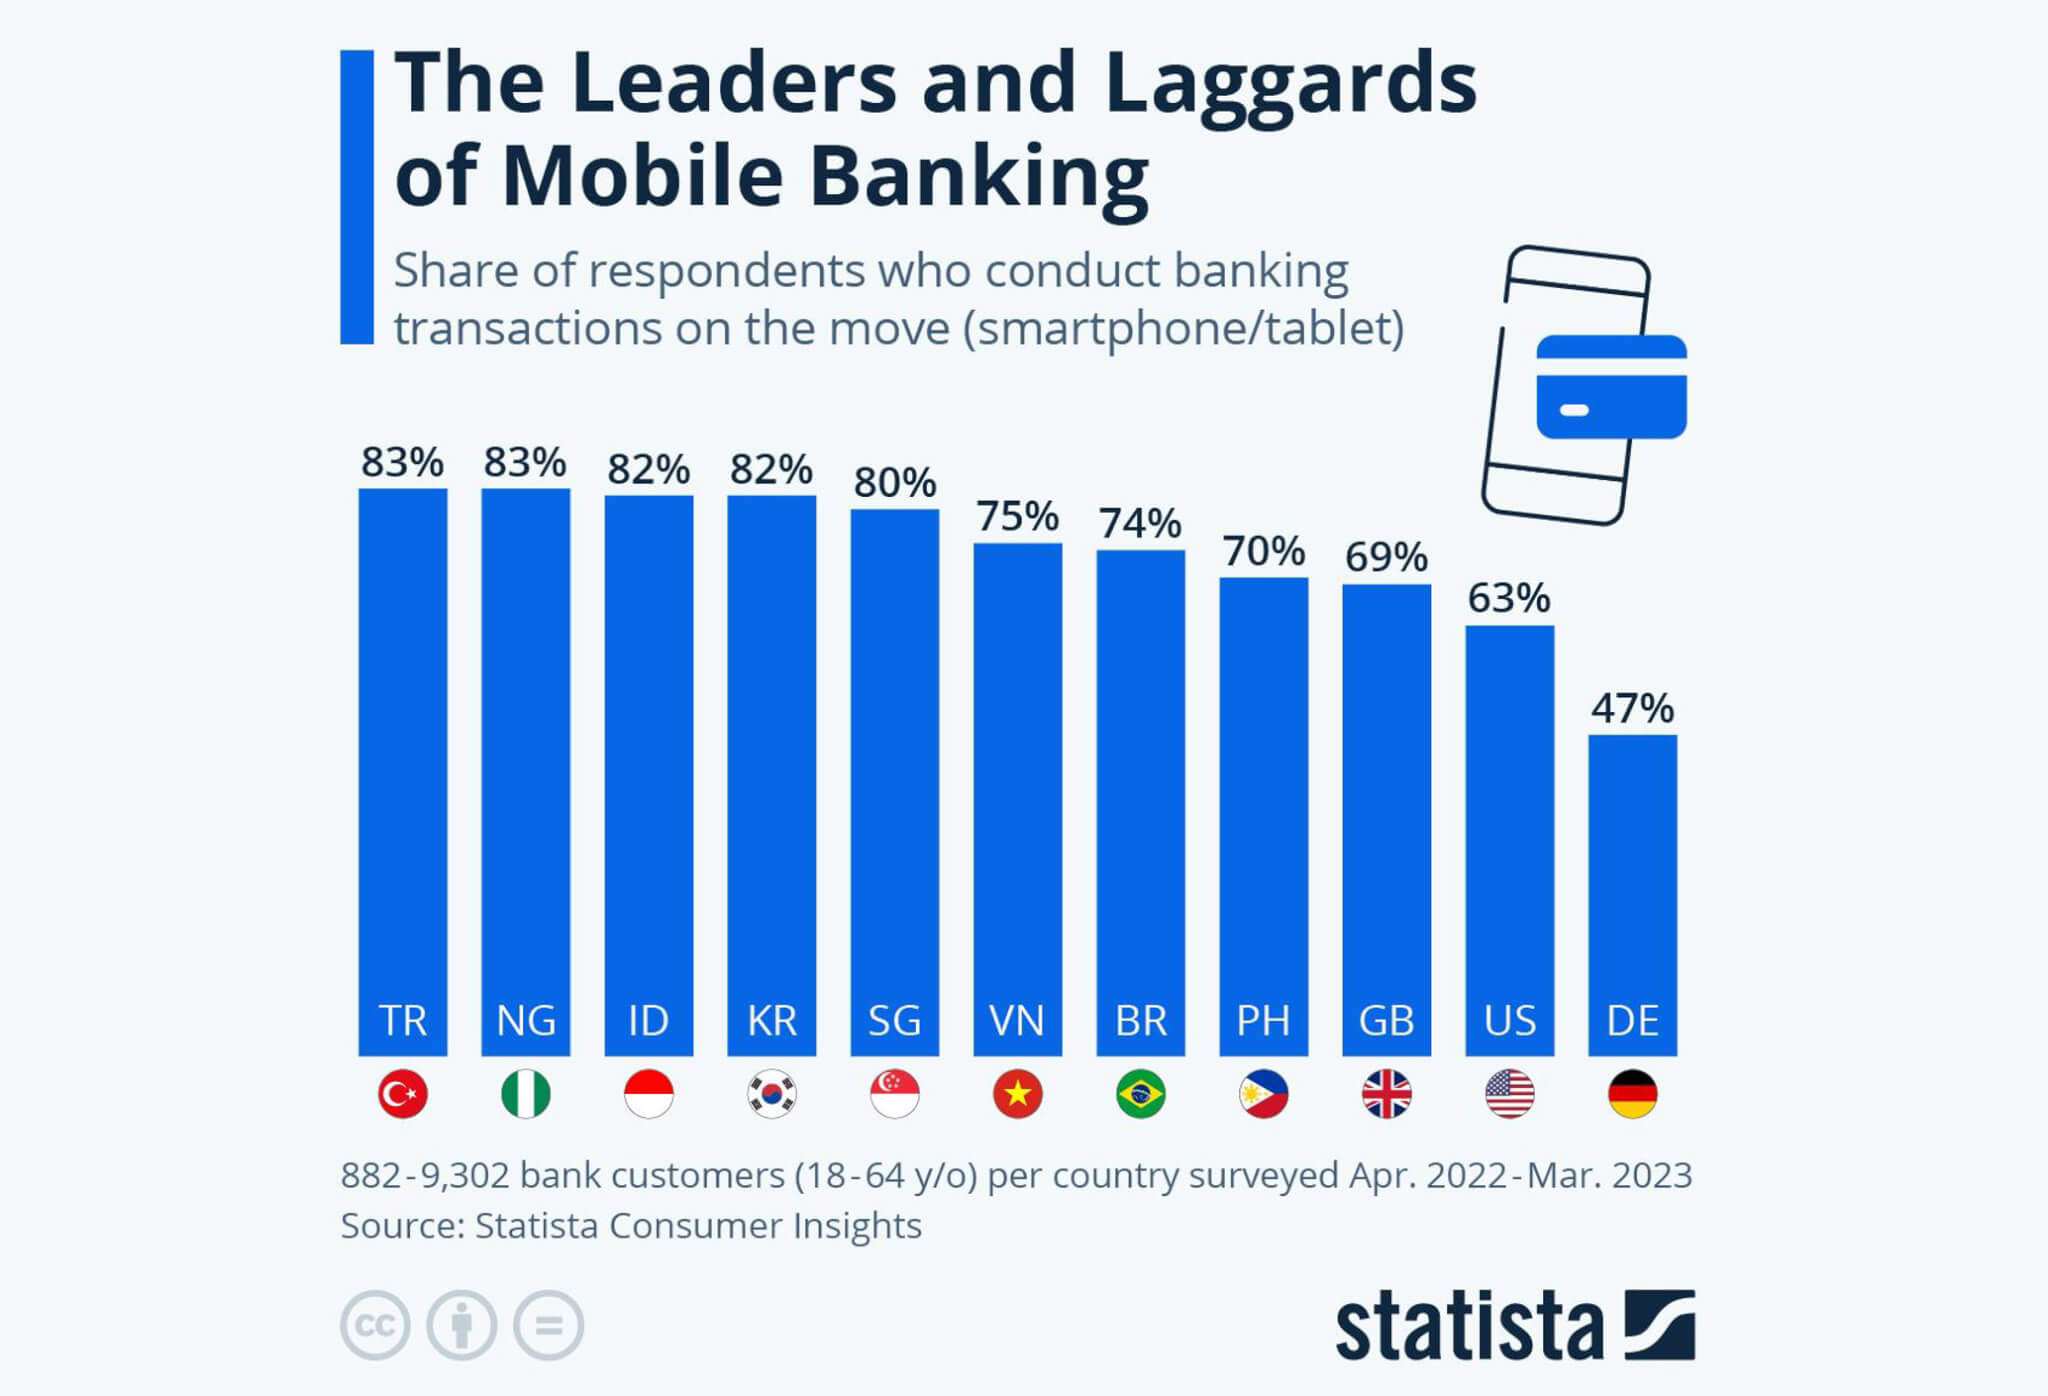
- In 2023, Turkey and Nigeria led in mobile banking adoption: 83% of surveyed users in each country used banking apps.
- APAC growth was confirmed in 2024, when digital wallet transaction volume in China alone reached $7.6 trillion.
The Africa angle is technically relevant: when building crypto-friendly banking platforms for markets in Sub-Saharan Africa, the architectural decisions look fundamentally different from a European neobank. Offline transaction queuing, ultra-low-bandwidth API optimization, and lightweight KYC flows are non-negotiable — and this is before even touching the blockchain settlement layer.
Mobile Banking Security & Fraud Statistics
According to the Entersekt survey, 71% of banking app customers stated they prioritize transaction security over ease of use.
According to the Global Financial Crime Report, total fraud losses in 2025 reached $517.4 billion — up 8.2% year-over-year. Payment fraud losses in the EU/EEA in 2024 reached EUR 4.2 billion. Mobile phones remain one of the primary vectors for digital attacks.
Important: 90% of surveyed finance professionals noted an increase in AI-assisted attacks between 2024 and 2026. This means traditional rule-based fraud detection is no longer sufficient — AI-powered behavioral analytics are becoming the minimum viable baseline.
Yuri MusienkoBusiness developer, MereheadStatistics on primary attack types:
- Phishing scams. Attackers use credential theft and OTP code interception to make unauthorized purchases. In Singapore, phishing ranked 2nd among registered scam types in 2025 with 6,264 cases.
- Malware. "Banking trojans" for mobile devices can intercept SMS messages, remotely control a device, and substitute recipient details in real time.
- Authorized Push Payment (APP) Fraud. A major portion of losses comes from schemes where clients approve transactions under social engineering pressure. Fraudulent credit transfers in the EU in 2024 totaled EUR 2.5 billion (+24%), and card payments EUR 1.3 billion (+4%).
One risk mitigation method is biometric authentication adoption (Face ID, fingerprint). By 2026, it has been implemented by ~64% of banks.
Data Breaches in Mobile Banking
According to the Banking Trust and Technology Report – Integris 2026:
- 50% of banks reported a mobile device-related breach in the last 12 months.
- 67% of clients say they would consider switching banks after a major breach.
According to the IBM Cost of a Data Breach 2025 report, the average data breach in financial services cost banks and financial organizations $6.08 million — including breaches through mobile banking apps.
Mobile Banking Growth Trends 2026
Mobile banking is part of the broader digitization wave and a key growth driver for the digital banking market (78% mobile banking preference). Core trends and their deployment rates in 2026, per Market Growth Reports:
- Artificial Intelligence: 66% of banks have deployed AI for fraud detection; 71% use AI analytics to prevent unauthorized transactions; 69% apply AI for customer interaction.
- Security & Verification: 64% of banks have implemented biometric authentication.
- Infrastructure: 57% of banks have migrated to cloud platforms.
- Open Banking: 52% of banks have deployed API integrations for third-party services.
- Customer Service: 38% of customer requests are handled by chatbots without staff involvement.
The overall automation trend continues: automated account opening has increased account volumes by 57%, reducing customer verification time by 63% and lowering user onboarding barriers. Digital lending integration has delivered a 41% improvement in operational efficiency.
The Open Banking API trend is particularly relevant for blockchain-based banking use cases — decentralized identity, programmable compliance, and cross-chain settlement all become significantly more viable once a bank exposes standardized API layers. The 52% adoption figure suggests the infrastructure groundwork for Web3 banking integrations is already in place across most major institutions.
Mobile Banking App Development: What the Data Shows
In 2026, total bank investment in building and updating their digital systems, mobile apps, and online services is projected at $15.79 billion — up from $13.79 billion in 2025. This proves that most banks have accepted mobile apps as the primary customer interaction channel.
Building a traditional banking app takes 4 to 8 months, while developing a full neobank or virtual bank requires 6–12 months on average.
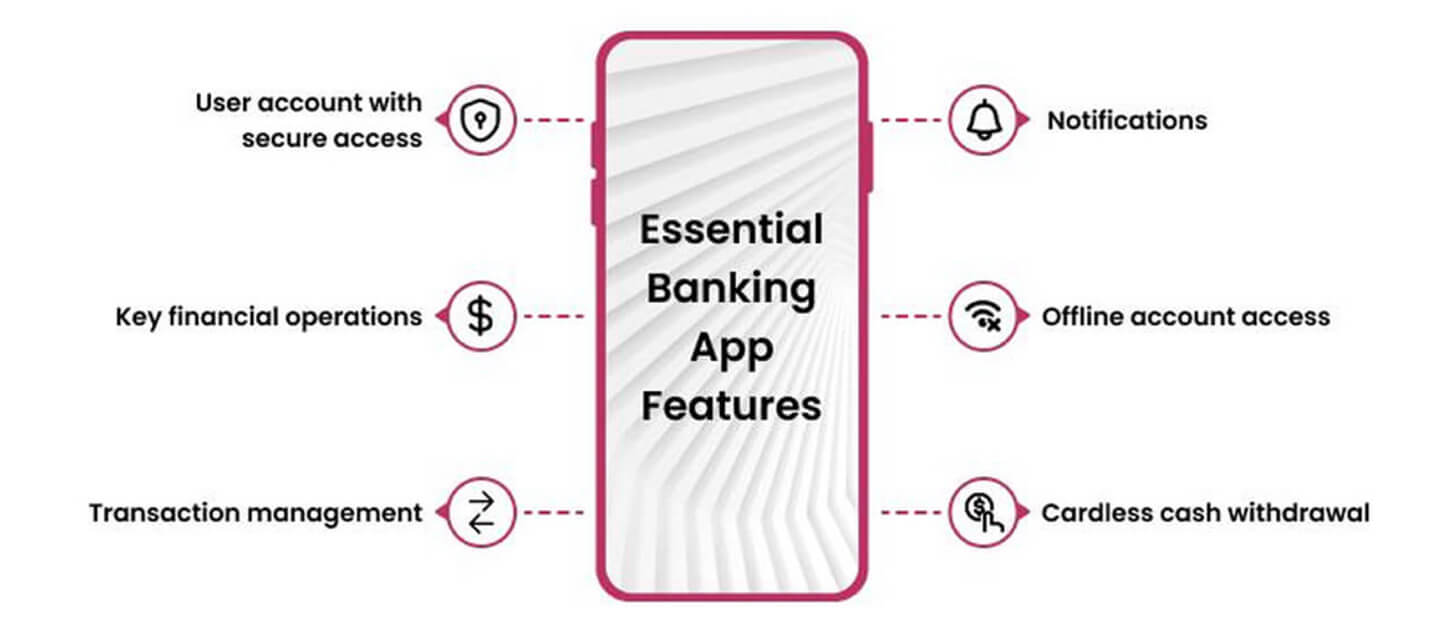
What banking app development includes:
| Core Modules | Top Additional Features |
| Account & Auth: Registration, 2FA, sessions, account recovery. | Multi-account management: unified dashboard for all accounts and cards. |
| User Profile: Data management, KYC, notification settings. | TradingView charts: chart integration for investments/crypto. |
| Deposit: Gateway selection, data entry, payment confirmation. | Cardless ATM: Cash withdrawal via NFC or QR. |
| Withdrawal: Fund withdrawal, limits, fee calculation. | AI support: 24/7 chatbot. |
| Transaction History: Filters, statuses, updates. | Voice payment: voice-confirmed operations. |
| Balance Display: Account balances, demo/real separation. | Smart device sync: notifications and balances on wearables. |
| Push Notifications: Transaction and security alerts. | Affiliate program: referral system with analytics. |
| Admin Panel: User management, KYC, and monitoring. | Futures/DEX: leveraged trading tools and order management. |
The Futures/DEX row in that table is no longer exotic. We recently integrated perpetual futures — with cross/isolated margin, TP/SL orders, and TradingView charts — directly into a non-custodial mobile wallet. The demand for this feature set from retail fintech clients is growing fast.
Yuri MusienkoBusiness developer, MereheadThe price of developing a classic banking app (iOS + Android) typically ranges from $60,000 to $100,000. White-label deployment is available at $5,000–15,000. Some development companies also offer crypto banking app development — pricing ranges from $20,000 to $160,000 depending on blockchain integration depth.
For teams working on crypto-enabled banking platforms, a key architectural decision is whether to build a custodial or non-custodial wallet layer. One of our instant exchange projects ran on self-hosted Bitcoin, Ethereum, Litecoin, Tron, and BNB Smart Chain nodes with SEPA fiat integration — making the infrastructure cost and DevOps complexity substantially higher than a standard banking app, but enabling full control over the transaction pipeline. A detail many teams underestimate: BTC node sync alone takes 5–10 days on modern hardware. If it isn't started on project day one, it becomes the item that holds up your go-live date.
Conclusion: Key Takeaways
The 2026 statistics confirm that mobile banking has become the baseline channel for 82% of clients — which logically reshapes infrastructure development priorities. The absence of a complete "digital hub" with investment and other advanced features leads to audience attrition, especially among Gen Z and Millennials. And since 50% of users are ready to switch banks over security concerns, implementing biometrics and AI protection is an obligatory safeguard against losses.
Given the market's growth to $15.563 billion in 2026, selecting a reliable fintech development partner is a prerequisite for a competitive banking app. For projects that need to go to market quickly without compromising on security architecture, mobile banking app development with a full-stack fintech team — covering backend, mobile, KYC integrations, and compliance — remains the most viable path.
FAQ
In 2026, approximately 2.17 billion users have mobile banking accounts, per Market Reports World.
In the US, mobile banking users reached 215+ million in 2025, according to Market Growth Reports.
Top US banking apps by Google Play downloads: Chase Mobile (50M+), Bank of America (50M+), PNC Bank (10M+).
Banks are actively deploying fraud prevention mechanisms: 66% have implemented AI-based fraud detection in 2026, and 64% use biometric authentication. However, 50% of banks reported a mobile-related breach in the past 12 months, which means security architecture quality remains a critical differentiator.
Key 2026 mobile banking trends: AI integration (66% of banks use AI for fraud detection, 69% for customer interaction), biometric authentication (deployed at 64% of banks), API integrations for third-party services (52%), and cloud infrastructure migration (57%).
A classic iOS + Android banking app costs $60,000–$100,000. White-label deployment starts at $5,000–15,000. Crypto banking platforms with blockchain integration range from $20,000 to $160,000 depending on the tech stack and feature scope.
Millennials (67% adoption) edge out Gen Z (63%) in raw usage share. But consumers aged 25–34 collectively drive over 21% of all banking app transactions despite representing 11% of the user base — making them the dominant revenue-generating cohort.
The 2026 industry standard for financial app session duration is 5–6 minutes. Banking apps also average 11 logins per week per user — significantly higher than most other app categories.